

Table of Contents
Introduction
Wireshark is the world’s most widely used network protocol analyzer, enabling us to examine network activity in detail. If you’re interested in getting started, consider a Wireshark download to analyze your network at a microscopic level.
Wireshark itself is an open-source project, so it has a lot of volunteer support. At the same time, Wireshark has a rich set of features, including:
……
Wireshark home page: Download Wireshark
So how do we capture and debug TCP packets using Wireshark?
Interface List
Wireshark can help you see the entire network traffic and give you a deep understanding of each packet. Moreover, Wireshark operates consistently on macOS, Linux, and Windows. When you open Wireshark, you will first see a screen for selecting a network interface, as shown below.
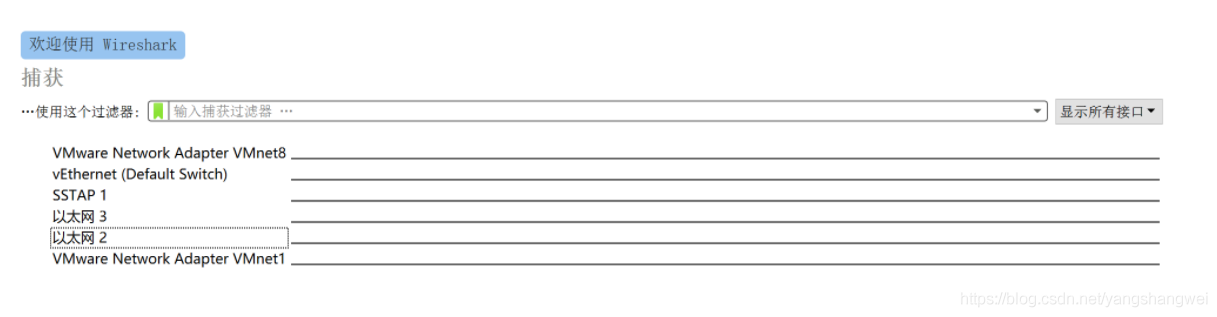
The first thing we need to do is select a network interface. On Linux, you can use the ‘ifconfig’ command to see all network interfaces, while on Windows, you use ‘ipconfig’. As shown in the above picture, there are many network interfaces, and currently, the interface connected to my router is Ethernet 2.
Start the Capture Feature
Once the interface is selected, clicking the button on the top left will start the capture. Once started, you’ll see individual data entries.
Since there is a lot of data in the entire network with many applications using the network, you will see many data entries, each representing a data send or receive. As shown below:
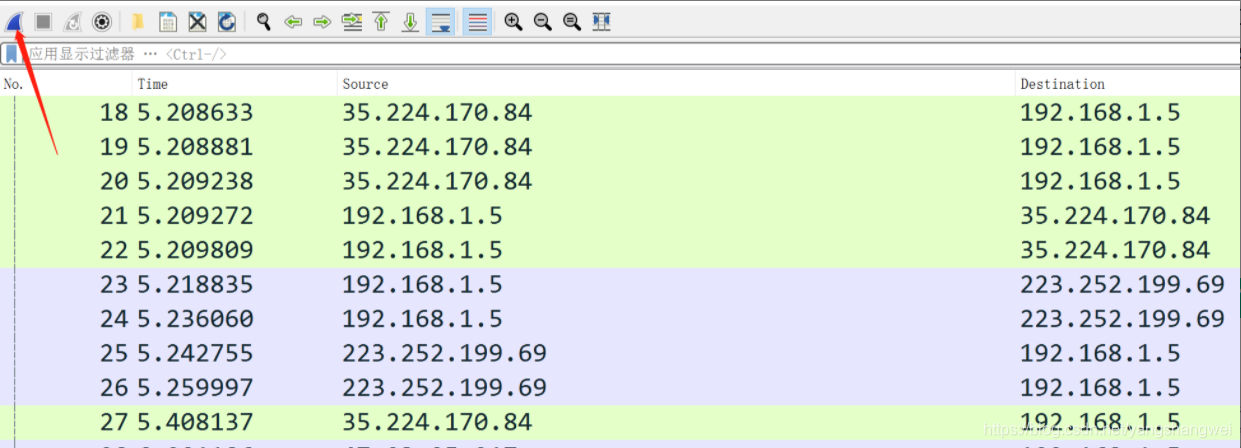
The following are the specific captures:
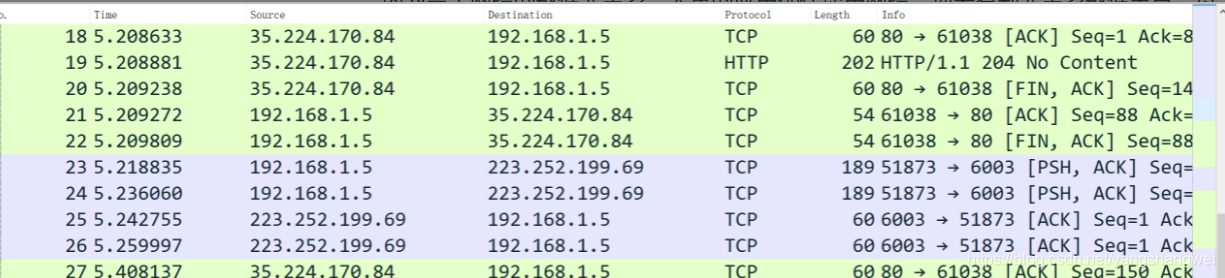
Observe the TCP Protocol
If you specifically select a TCP protocol capture, you can see the content as shown below:

Below this, you can observe detailed content:

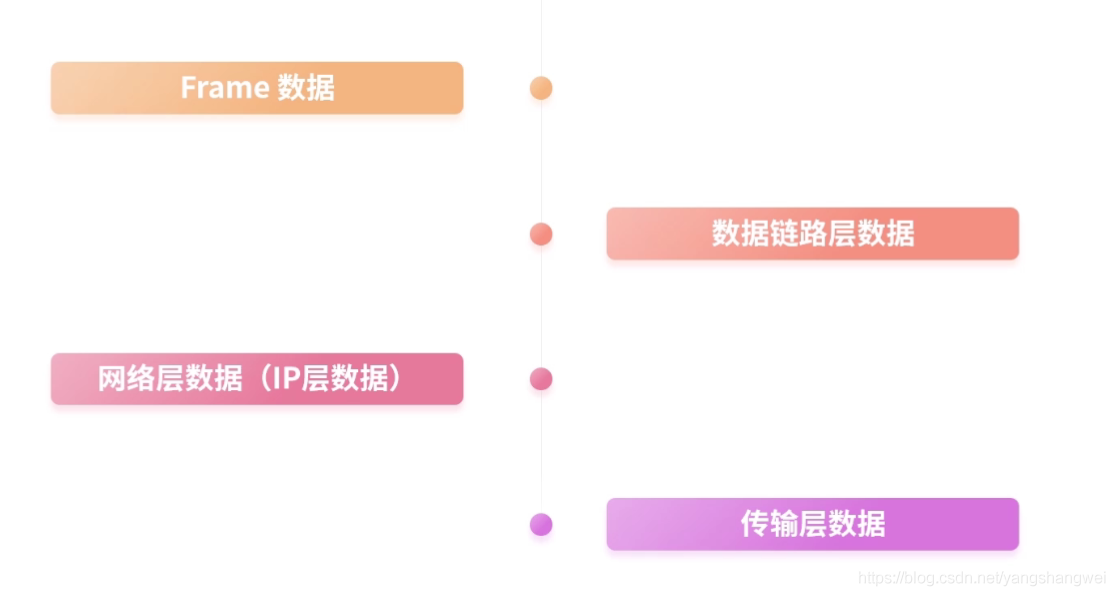
We can observe this capture from different layers. From the transport layer, it is a TCP segment; from the network layer, it is an IP packet; from the data link layer, it is a Frame.
By checking different layers to observe this TCP segment, you can gain a more detailed understanding of it. For example, below is the understanding from the TCP layer of this capture:
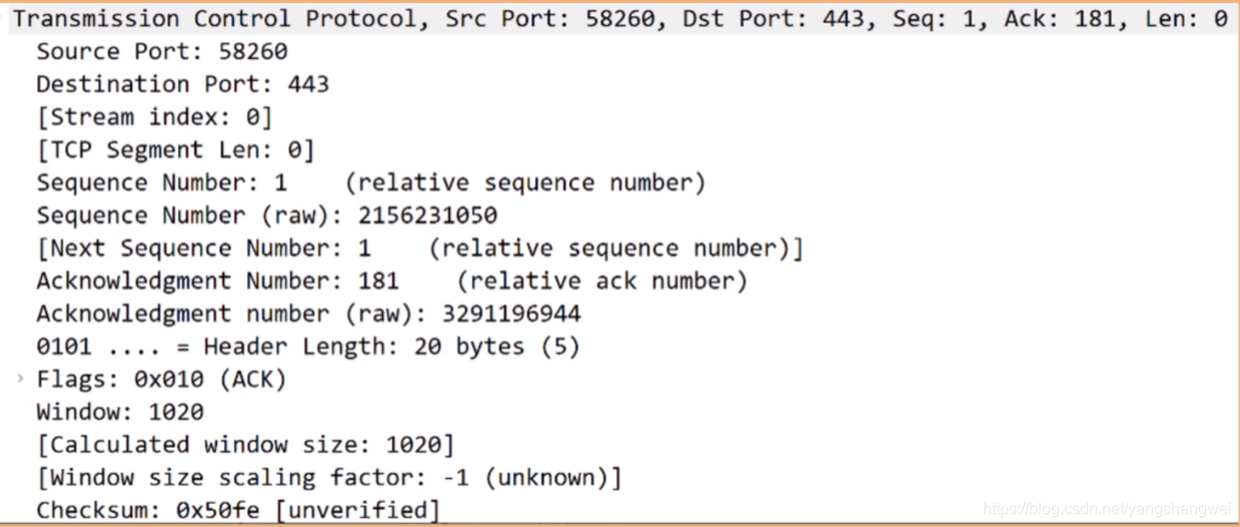
You can see that this capture is an ACK (see Flags) field sent from port 58260 to 443, so it is likely a response from an HTTPS client to the server.
Message View
If you select a message, a message view will appear below. There’s also a binary view, which shows the data in binary form, and the message view is an interpretation of that binary form.
Wireshark traces the Frame being transmitted by the bottom layer network card, allowing it to trace back to the data link layer. Therefore, the binary form interpretation, or our message view, also needs to be layered. This is because the interpretation of the same data varies at different layers.
Observe the HTTP Protocol
Wireshark can also be used to observe other protocols, such as the HTTP protocol. Below is a capture of the HTTP protocol:
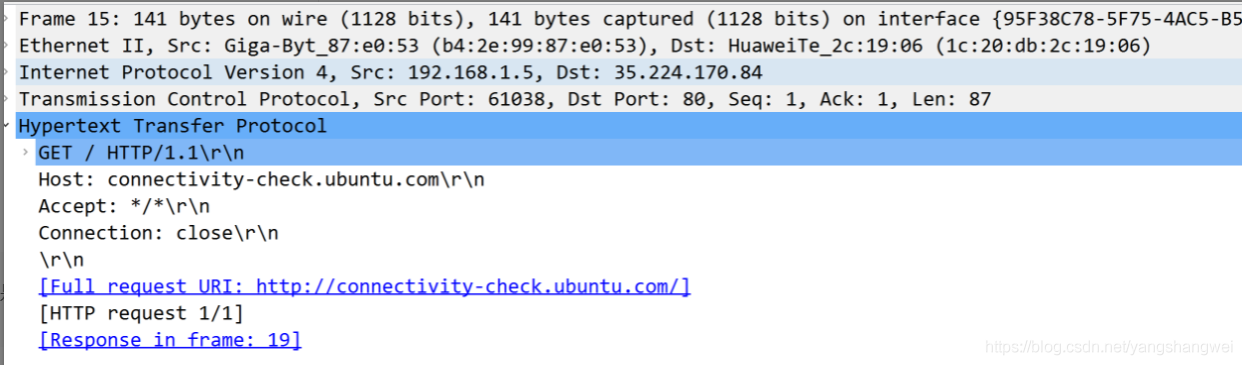
As you can see, Wireshark not only captures the application layer but also provides a view of the corresponding transport layer, network layer, and link layer data for this HTTP capture.
Filtering and Selection
Wireshark also provides capture filtering, where you simply need to input the filtering conditions to see only the captures that meet these conditions.
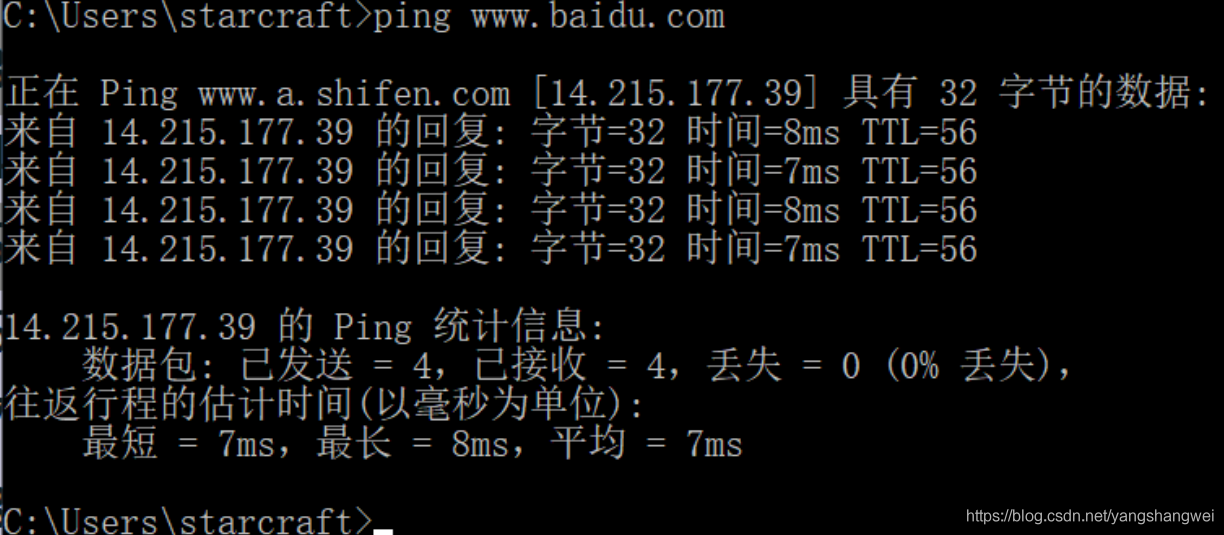
For example, if we want to analyze a handshake with Baidu. First, start capturing, then enter Baidu’s URL in the browser, and finally, use the ‘ping’ command to check Baidu’s IP address, as shown below:
After seeing the IP address, we enter an expression in Wireshark, as shown below:
What you see are all the connections associated with Baidu. The above picture shows a complete process from establishing a TCP connection (three-way handshake) to the handshake of the HTTPS protocol transmission. You can view only the requests from 192.168.1.5 to 14.215.177.39.
First, is the SYN sent by the client (192.168.1.5) and the SYN-ACK returned by Baidu, as shown below:

Then the client sends an ACK back to Baidu:

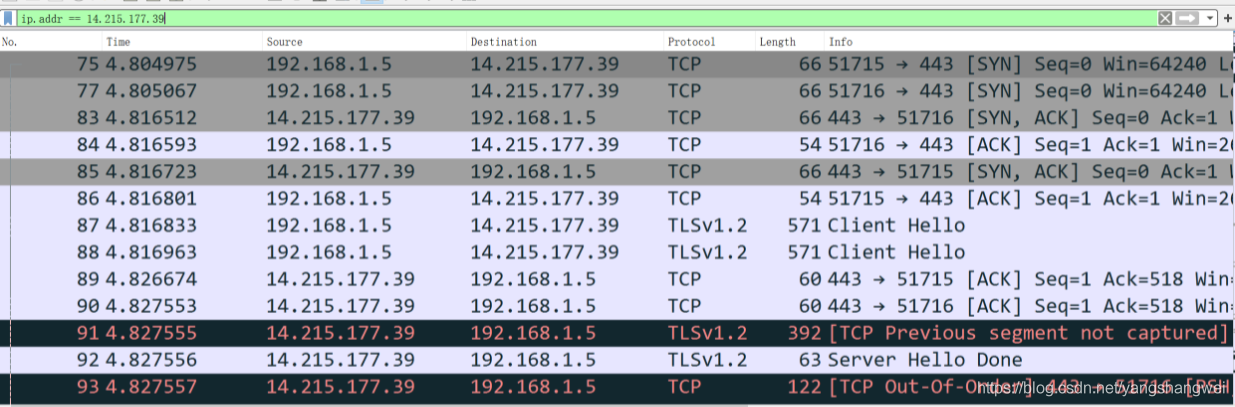
Next, the HTTPS protocol begins to work (start handshake):

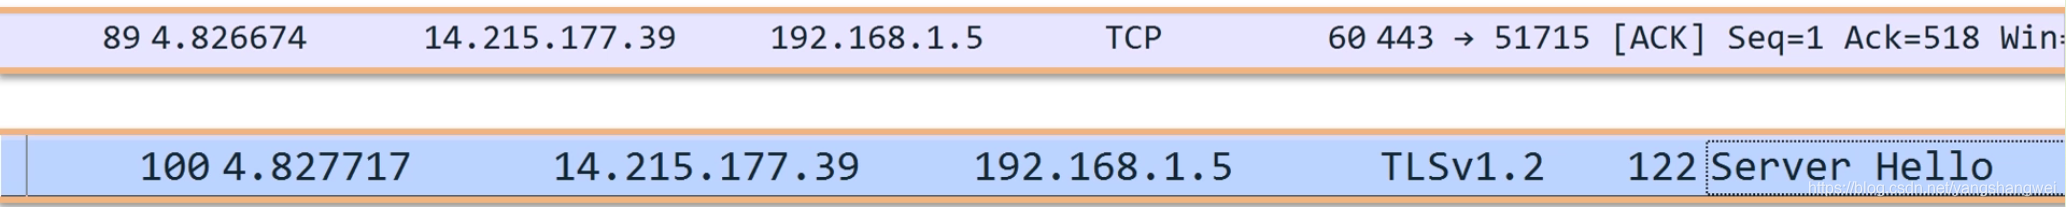
You can see that the HTTPS protocol sends a Client Hello to the server through TLSv1.2. The server then sends an ACK back to the client, followed by a Server Hello:
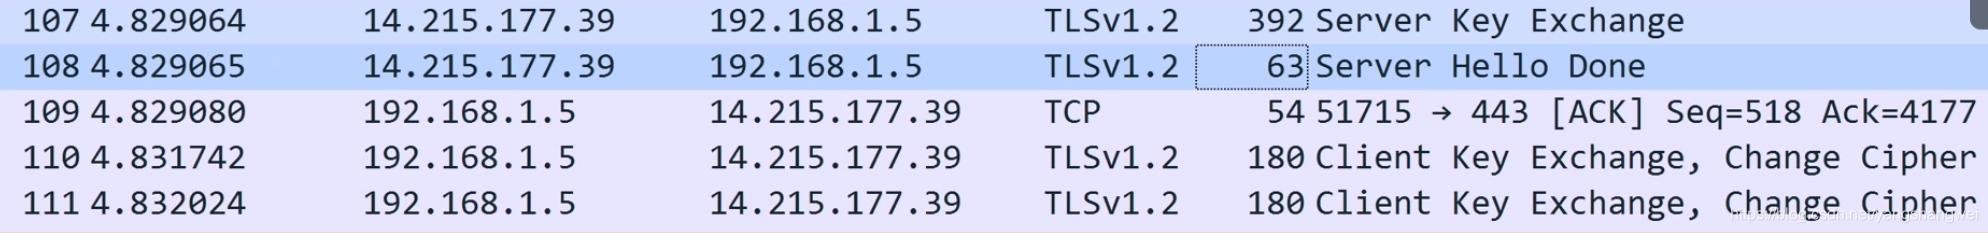
Then Baidu returns the certificate:

Finally, the key exchange starts, until the end of the HTTPS handshake:
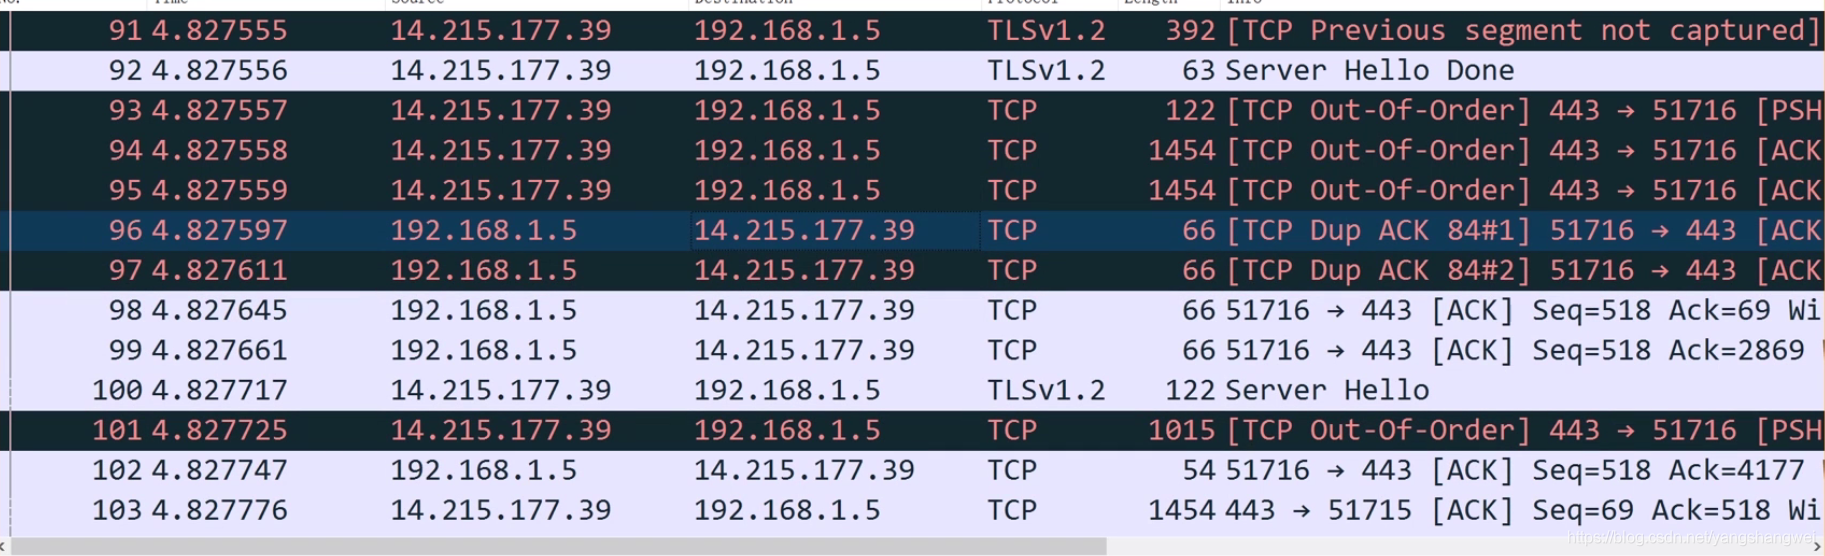
Packet Colors
During packet capture, black packets represent various packet errors; red indicates anomalies; other colors signify normal transmission.
Conclusion
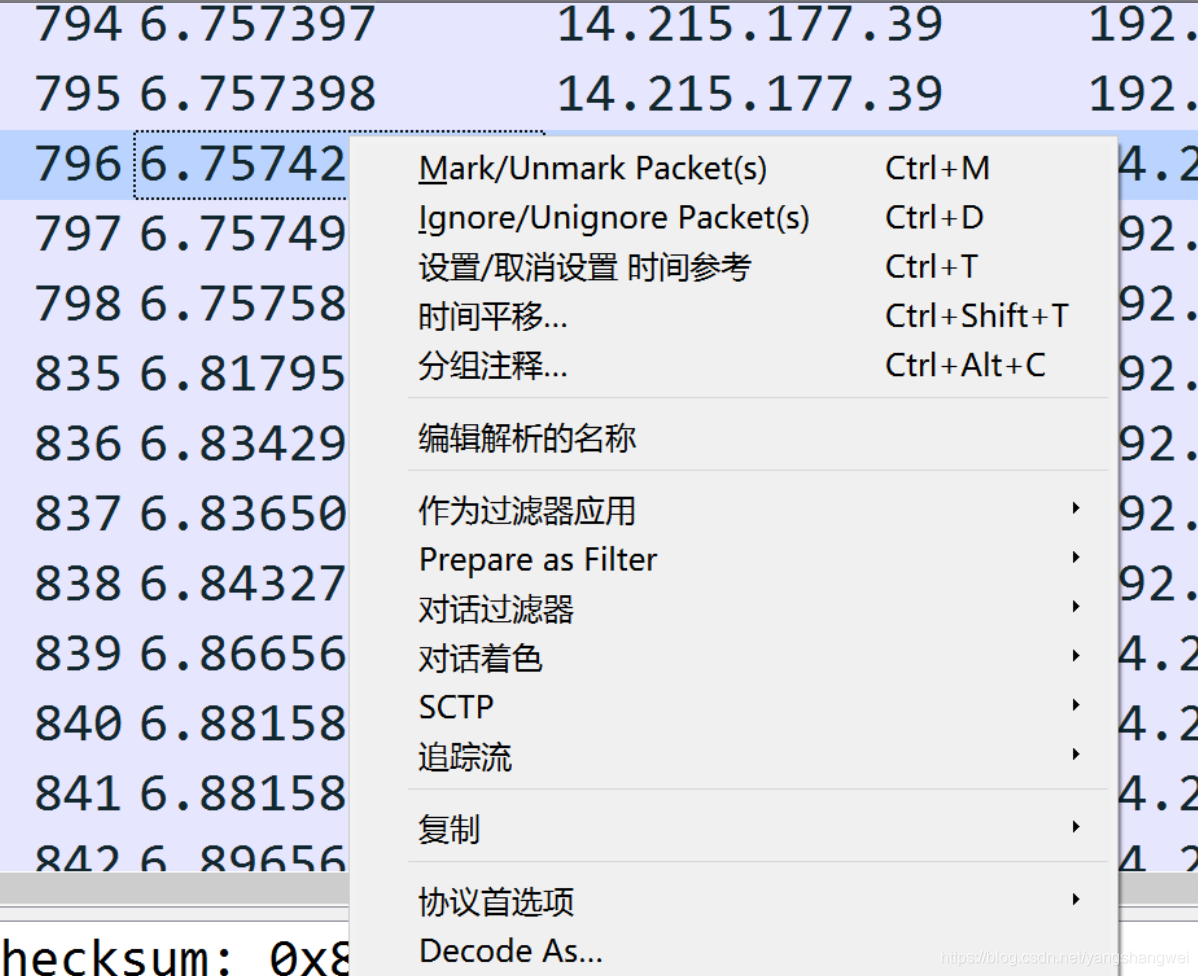
Wireshark is a powerful tool that supports many protocols. There are many more capabilities of Wireshark to explore. As shown below, right-clicking on a capture reveals many options that can be explored further.
QA: Write a UDP connection program in your preferred language and capture packets using Wireshark download.
Taking Java as an example, here is an echo service (that is, the server returns whatever the client sends). Below is the server program:
Below is the client program:
By observing the above two programs, you will find that Datagram messages are sent and received. Furthermore, there is no need to establish a connection between the server and the client. The server can differentiate clients by reading the client’s address, and the client sends data to the server via the server’s address and port.