

1. Background and Demand Introduction
The most popular tool for capturing traffic is Wireshark. On Windows, Wireshark’s GUI is quite cool, but for users accustomed to using tcpdump on Linux and Mac, the command-line tcpdump is more direct and convenient. Is there a similar packet capture tool on Windows? The answer is yes, and it’s windump, a command-line tool based on the winpcap library.
The general background is this: a Windows server is running a relatively customized closed-source authentication service. Since this is a legacy service, it doesn’t have a complete log output mechanism, making it impossible to gather user traffic data from the existing logs. It is unclear at what degree of service stress problems will occur. From the current data, it’s hard to identify anomalies, calculate traffic distribution, estimate peak alert values, or visualize the current service status. With the increase of associated external services, the service pressure is consistently rising.
The following demands have been organized based on the current situation:
1.1 Quantitative monitoring of traffic without intrusive coding. 1.2 Transferring traffic log data to a big data platform for non-real-time statistics to identify threshold alerts. 1.3 Use a self-developed monitoring tool based on winpcap instead of windump for real-time data analysis, threshold alerts, and visualization of the load status.
This article focuses on achieving the first two points using windump and big data graylog, with the third point discussed later. So, we’ll start with several software tools but won’t delve into much coding. The software includes windump, sidercar, nxlog, and graylog is not specifically introduced for installation and usage.
Windump is equivalent to tcpdump on Linux and Mac. In some scenarios, using windump on the Windows platform is more convenient than wireshark. Wireshark is GUI-based and supports Lua plugins; we might introduce wireshark’s Lua plugin in the future. Windump is a great tool for analyzing protocols like tcp/udp/icmp. Here is a brief introduction to its usage. In the latter stage, we use the command-line tool windump.exe to analyze our application server, assess the limit of our server’s stress tolerance, and determine the threshold through stress test scripts.
2. Windump Download and Usage
We need to provide a brief introduction on how to use windump.
2.1. windump.exe -D
Display all network cards. -D can list all network devices on the machine, including virtual network cards established by VMs.
2.2 windump.exe -i 1
Monitor specified network card. The number following -i indicates the local network card’s corresponding sequence number, displayed with -D. The number following -i is the name of the machine’s network card sequence.
2.3 windump.exe -i 1 udp
Monitor specified protocol data. The udp keyword indicates monitoring udp protocol traffic.
2.4. windump.exe -i 1 udp port 9999
Monitor specified port data. After specifying the port, it only monitors traffic data flowing through this port.
2.5. windump.exe -i 1 udp port 1234 and host192.168.0.3
Monitor data of a specified host. Specifying an IP only monitors local data packets associated with this IP.
2.6.windump.exe -w cap.log -i 1 udp port 1234 and host 192.168.0.3
Write traffic records to a file. We store monitored packets for future analysis.
2.7. windump.exe -f cap.log
Read traffic information from a file. Data stored with -w is not in clear text, and needs to be displayed with -f to show normal ASCII code, understandable by humans.
Download and official documentation:
https://www.winpcap.org/windump/docs/manual.htm
3. Deployment of Sidercar and Nxlog Big Data Tools
3.1 Download sidecar from GitHub.
collector_sidecar_installer.exe
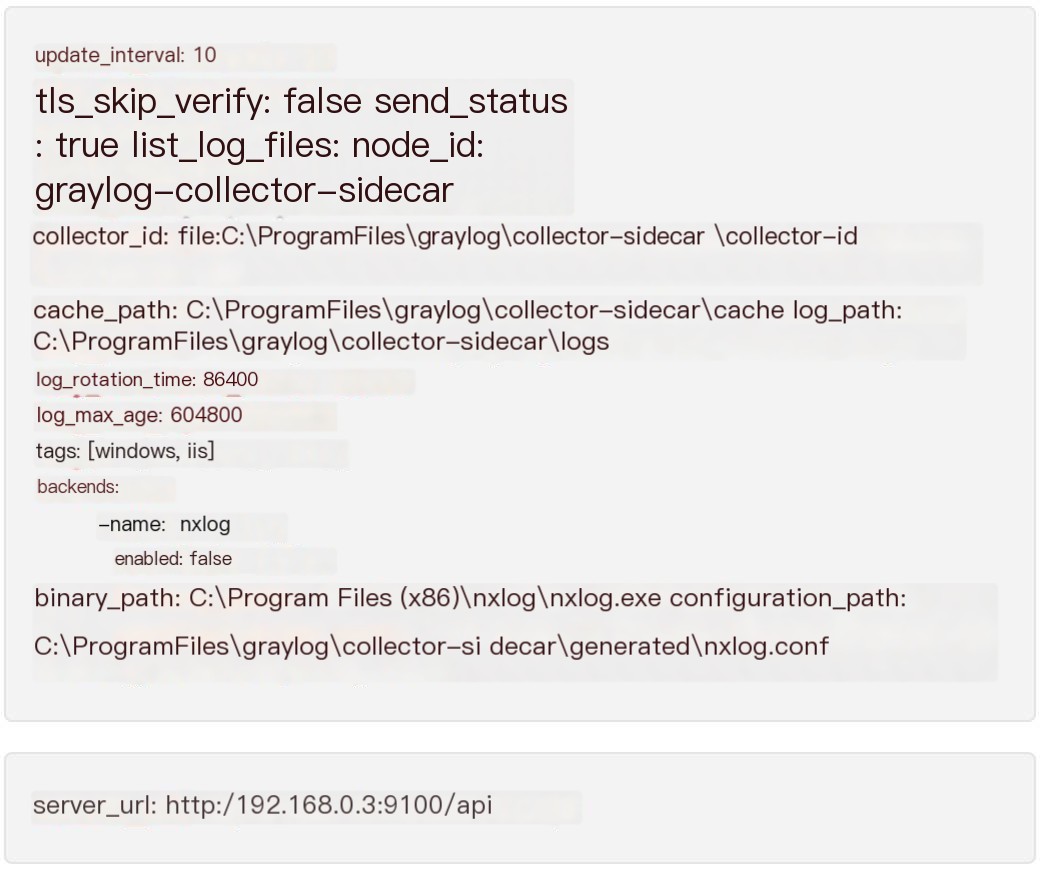
3.2. Configure the configuration file of sidecar.
 />
/>
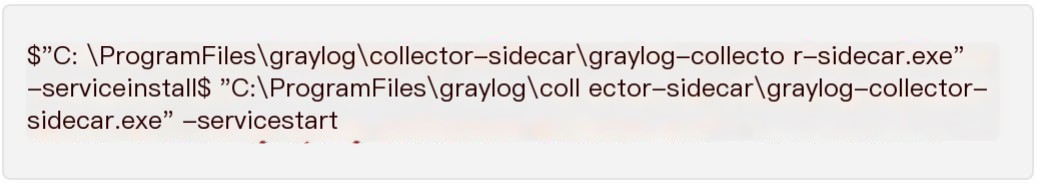
3.3 Install, set services, and start.
 />
/>
3.4. Install nxlog.
3.5. Configure nxlog.conf file.
The nxlog configuration file has a pairing relationship, defining Input, Output, and Route sections. The configuration file below only defines a correspondence relationship between Input and Output routing. Nxlog is modular; in this Input section, the module im_file is used to tell nxlog where to read local log files. Here, the log files are defined to be placed in c:\rlog\ for all .log files.
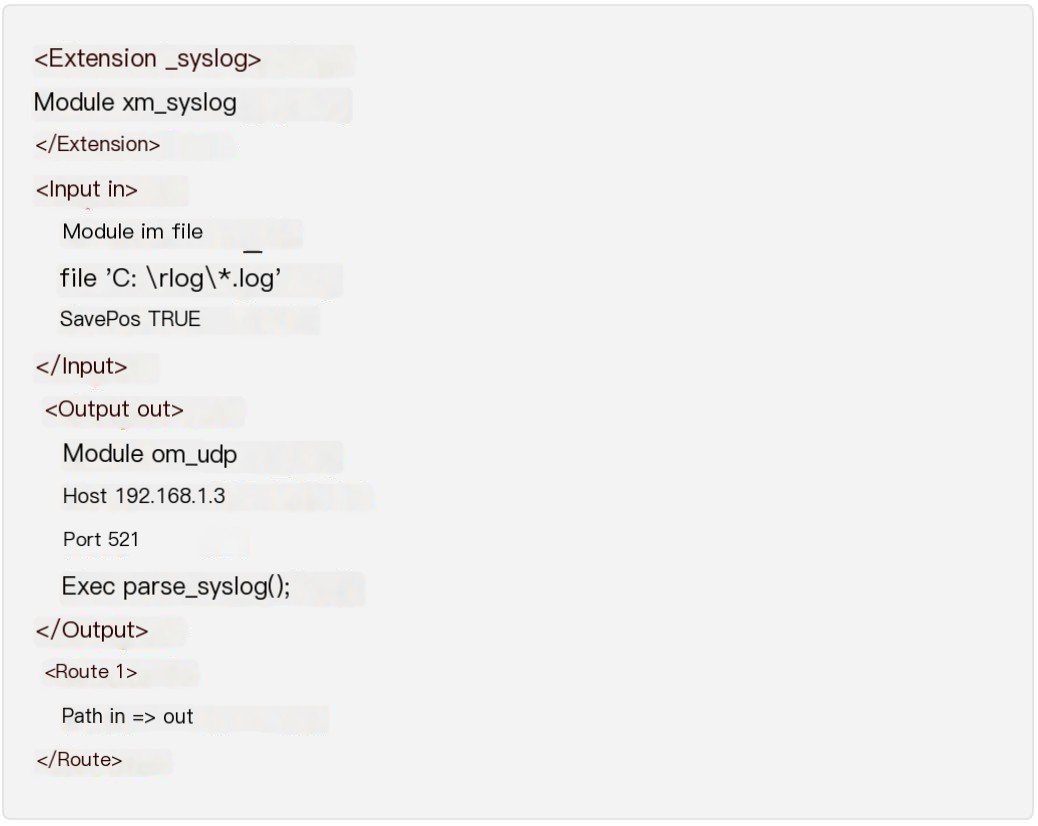
The Output section named out defines the protocol and format outputs are parsed into. Using the om_udp module, it uses the udp transport protocol to output the local log file in syslog format to a specified server, syslog server, or graylog data reception port.
3.6 Usage of nxlog service
3.6.1 Install service
nxlog -i
3.6.2 Stop service
nxlog -s
3.6.3 Start monitoring
nxlog -f
Check the default location of nxlog startup log. File location: C:\Program Files (x86)\nxlog\data
Upon normal startup, nxlog will display the following:
2017-08-16 17:02:15 INFO nxlog-ce-2.9.1716started
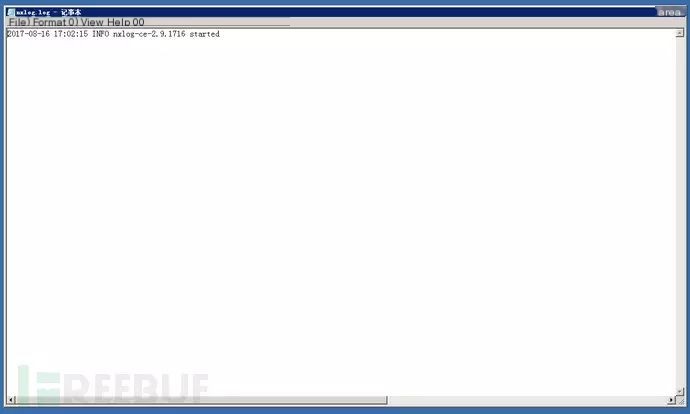
If this field appears, then it’s OK. If there are other warnings and hints, it might be due to errors in the configuration file.
4. Monitoring and Traffic Analysis
After installing these tools, we can monitor traffic and perform simple visual analysis on the graylog end.
4.1. Run windump and monitor test traffic of a specified IP.
windump.exe -i 1 udp port 9999 and 192.168.0.3
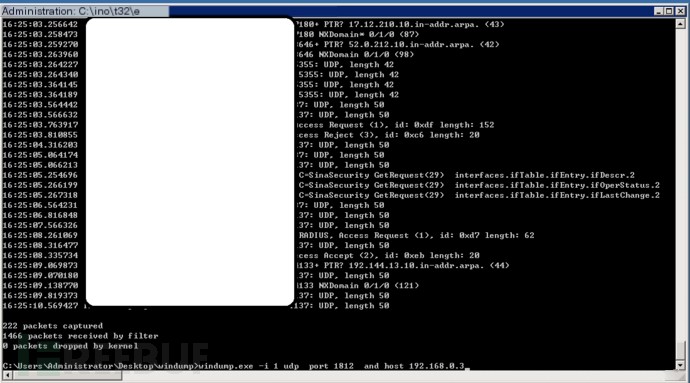
Our test script operates on the IP: 192.168.0.3, so we need to monitor all traffic related to this IP through local port 9999. We analyze the total proportion of source IP. This test case IP is primarily a single IP monitored. If the IP address is removed, it monitors all balanced load across RADIUS traffic on the local machine, allowing us to analyze which service applications have high request pressure and which applications are continuously rejected by the RADIUS service, indicating any abnormal request traffic. Usually, when the request and acceptance volume reaches a certain point, the service’s pressure becomes excessively high, necessitating alert emails.
4.2. Redirect windump output log file to a specified file directory.
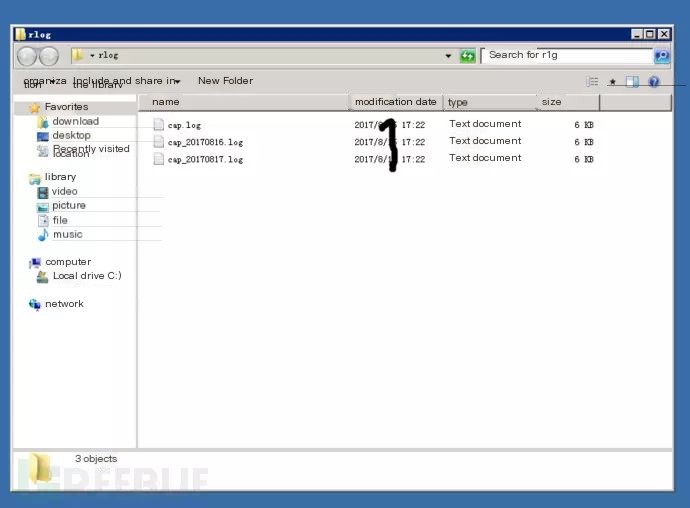
windump.exe -i 1 udp port 9999 and192.168.0.3 > c:\rlog\cap.log
We directly pipe the log file to the designated directory.
4.3. Run stress test script and check log generation results.
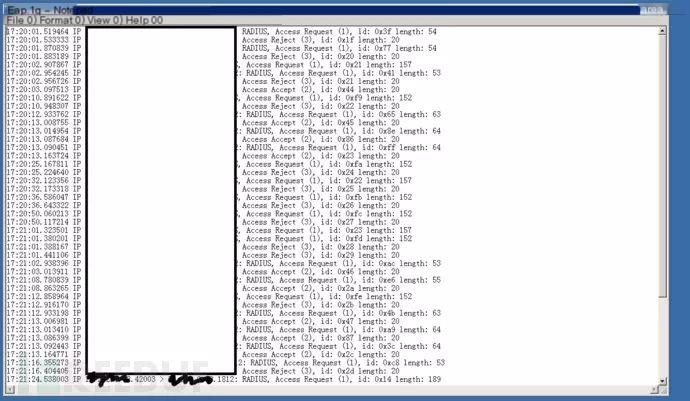
Generated traffic logs are created in the specified location and sent to the graylog ES cluster or syslog server.
4.4. After stopping monitoring, check graylog log results for analysis.
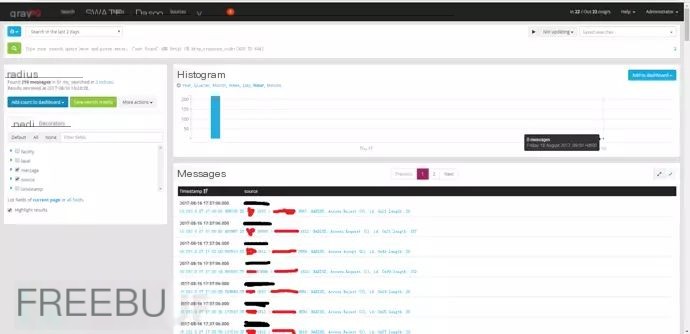
We can see in Graylog that the old Windows server flow monitoring data has been detected in the big data ES cluster. We then need to segment the IP field, possibly using the statistics of traffic status by the big data to provide the frontend with a REST API projection, displayed on a large screen.
5. Custom Traffic Collection Agents
We know that many packet capture tools use libpcap at their core, with support on mac, windows, and linux. If we need to customize filtering on the traffic collection side, filtering only specific traffic, or if we wish to relay traffic directly via syslog to other syslog servers, this means it’s possible not to deploy nxlog agents. Below is a C language example. The C version is much more efficient than Python and can also incorporate Lua within C for more convenient handling of traffic filtering rules and syslog sending. Below is a demonstration of C language implementation using libpcap to capture local port 80 data:
Environment installation dependencies:
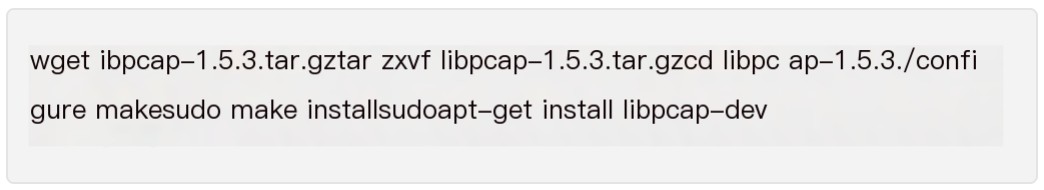
Source code:
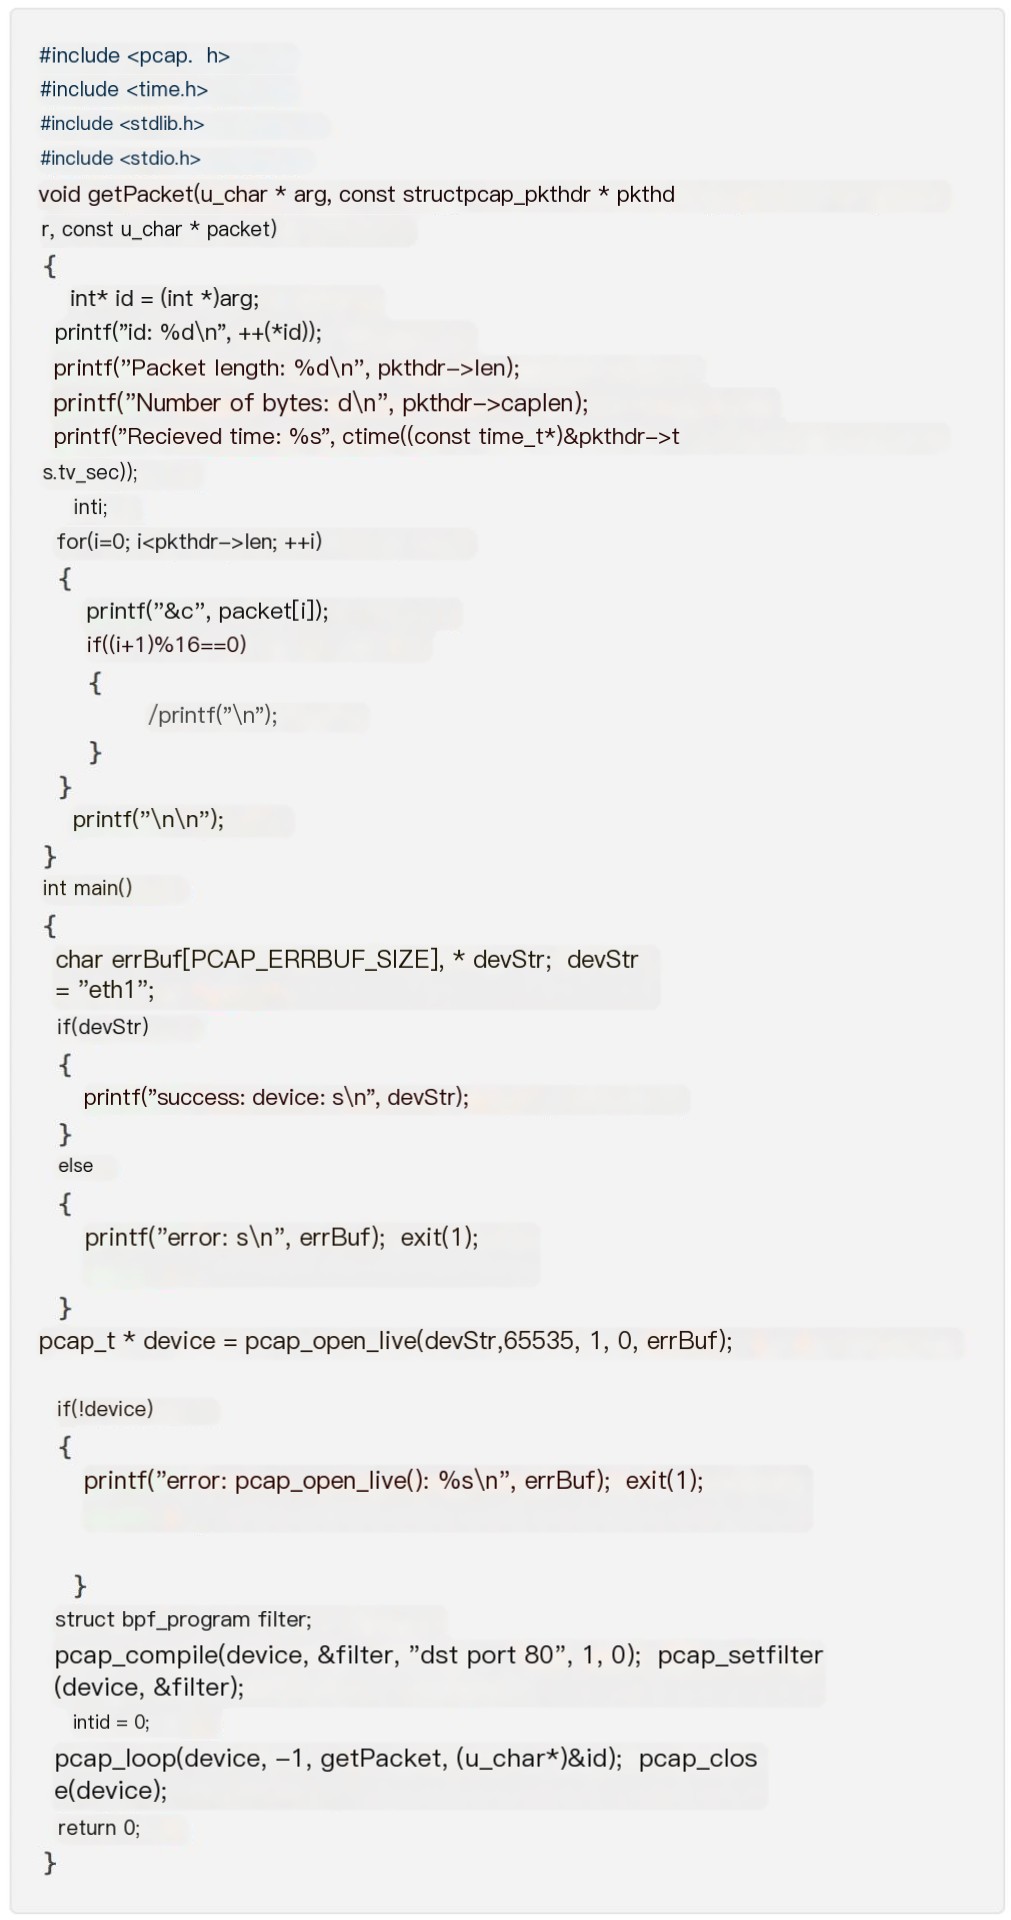
Compile:
gcc test.c -lpcap -o test
This program functions equivalently to:
tcpdump -i eth1 dst port 80 -l -s 0 -w- | strings
If we add Lua calls into the main event loop, we can filter and process stream data. This will be introduced later due to space limitations.
6. Conclusion
This article removes some real test IP information from the images. Regarding Graylog segmentation and data visual statistics and alert warnings, the use of monitoring code based on the Windpcap library will be provided later. Generally, we directly view the flow of a machine using IDS-related equipment, or the Syslog directly output by the equipment. Due to special equipment and system environments, to monitor their traffic, it’s necessary to adopt direct deep methods as mentioned in this article, allowing us to flexibly monitor old equipment and integrate its service status data into the big data platform for centralized management, letting old equipment software rejuvenate.