SRUM is considered a goldmine of forensic information because it contains all activities that occur on a specific Windows system. SRUM tracks and records program execution, power consumption, network activity, and more, allowing this information to be retrieved even if the source has been deleted. Such information enables forensic investigators to gain deep insights into past activities and events on the system.
SRUM Database
The Windows System Resource Usage Monitor (SRUM) was first introduced in Windows 8. SRUM tracks system resource usage for 30 to 60 days, particularly focusing on application resource usage, energy usage, Windows push notifications, network connections, and data usage.
SRUM stores data in an Extensible Storage Engine (ESE) database format. This database file contains multiple tables that record all activities on a specific system. There are multiple categories of data in the SRUM database.
- SRUM Application Resource Usage
- SRUM Network Usage
- SRUM Network Connections
- SRUM Energy Usage
- SRUM Push Notification Data
- SRUM Long-term Energy Usage
We will only discuss 1 and 2 as they provide the most value.
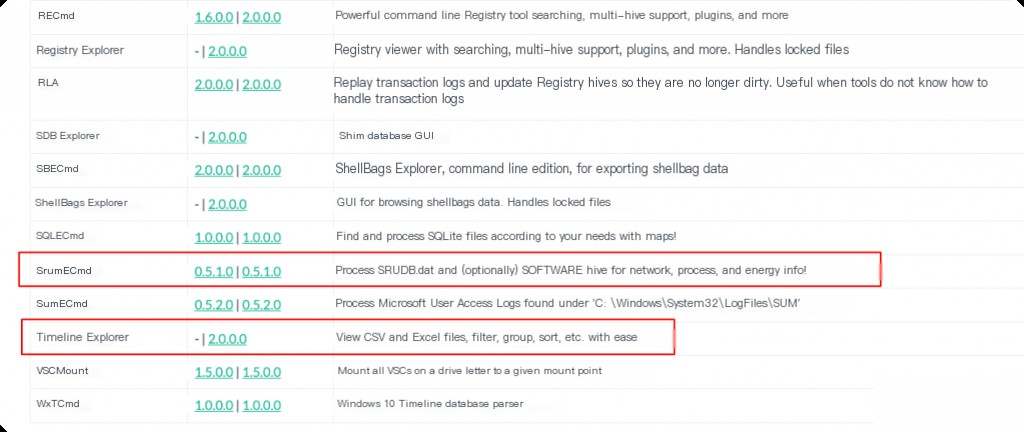
Download srumEcmd and timeline explorer
We use the tool srumEcmd developed by Eric Zimmerman to parse the database output into CSV format, and then open the CSV files with timeline explorer.
https://github.com/EricZimmerman/Srum
https://ericzimmerman.github.io
Parsing srum.dat file
SRUM is stored in a file named SRUDB.dat located at:
C:\Windows\System32\SRU\SRUDB.dat
First, we obtain the srum db file and copy it to the SrumECmd directory.
 C:\Users\Administrator\Downloads\SrumECmd> SrumECmd.exe -h
Description:
  SrumECmd version 0.5.1.0

  Author: Eric Zimmerman ([email protected])
  https://github.com/EricZimmerman/Srum

  Examples: SrumECmd.exe -f "C:\Temp\SRUDB.dat" -r "C:\Temp\SOFTWARE" --csv "C:\Temp\"
            SrumECmd.exe -f "C:\Temp\SRUDB.dat" --csv "c:\temp"
            SrumECmd.exe -d "C:\Temp" --csv "c:\temp"

            Short options (single letter) are prefixed with a single dash. Long commands are prefixed with two dashes
Usage:
  SrumECmd [options]

Options:
  -f                    SRUDB.dat file to parse
  -r                    SOFTWARE hive to process. This is optional but recommended
  -d                    Directory to recursively process, looking for SRUDB.dat and SOFTWARE hives. This mode is mainly used with KAPE to find SRUDB.dat and SOFTWARE hives
  --csv  (required)   Directory to save CSV formatted results. Be sure to enclose the full path in double quotes
  --dt                Custom date/time format to use when displaying timestamps. See https://goo.gl/CNVq0k for options  [default: yyyy-MM-dd HH:mm:ss]
  --debug                  Show debug information during processing [default: False]
  --trace                  Show trace information during processing [default: False]
  --version                Show version information
  -?, -h, --help           Show help and usage information
The necessary parameters are -f and –csv. The SOFTWARE registry file needs to be copied out in safe mode or from a PE boot environment, otherwise, it will be occupied by the system.
SrumECmd.exe -f SRUDB.dat --csv "./"
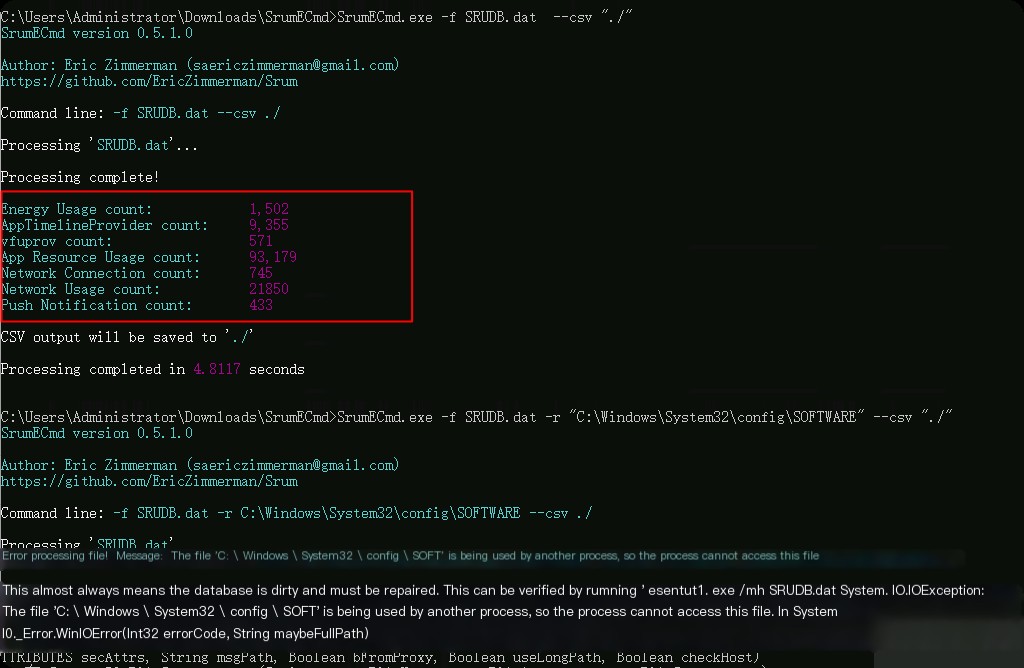
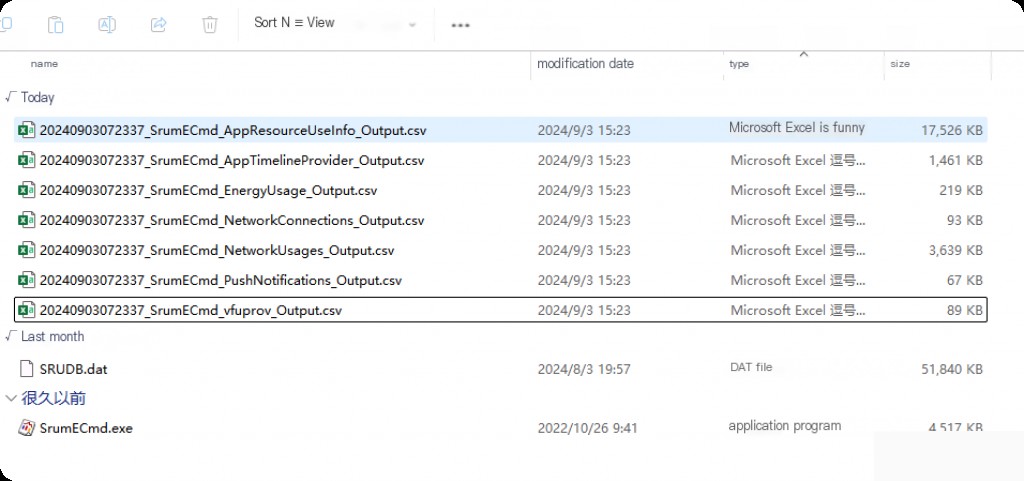
After execution, CSV files are generated in the current directory.
SRUM Application Resource Usage
This is the most important for us as it can serve as evidence of application execution. We can determine if any programs or malware were running and at what time. This can be linked with other forensics (such as prefetch) to prove application execution.
SRUM Application Resource Usage is one of the most useful categories and often the most complex. This is because it tracks every exe executed on the system, regardless of whether it still exists on the disk. As long as it was executed, it will be recorded. SRUM Application Resource Usage stores the full path of the application execution.
Now use timeline explorer to open these CSV files.
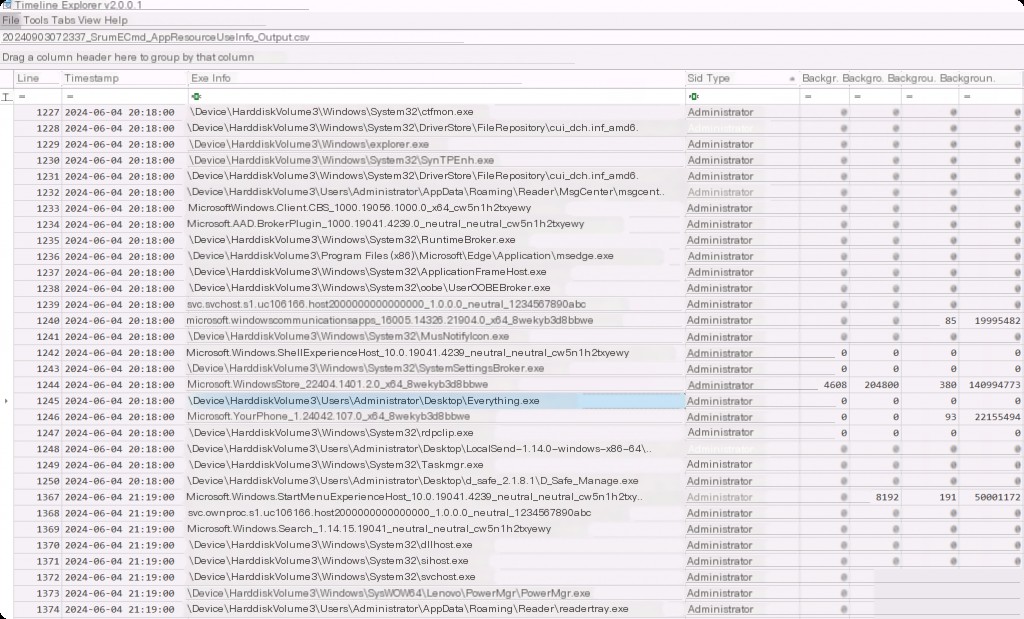
We can find many entries in this category, but the important ones for us are the exe information, which is the full path of the executed executable, the execution timestamp, and the username that executed it. This is very useful in cases where malware was executed on the system. We can find exes executed from strange paths or files with strange names and their run times. We can also get detailed resource usage information such as read, write, or CPU cycles used, read and write operations, etc.
These can be useful in cases where malicious programs cause more CPU usage or information theft during execution, which can be detected based on the bytes read and written.
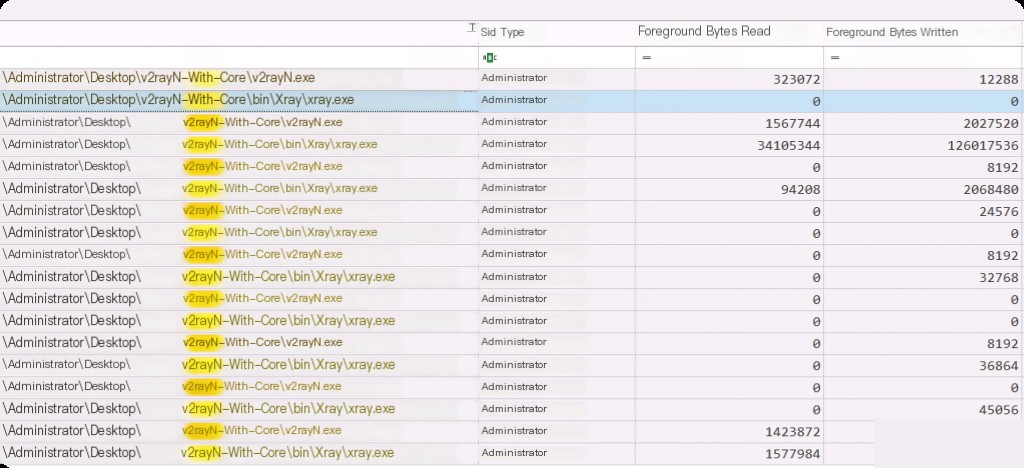
For example, we filter out the resource usage data of the v2ray process.
SRUM Network Usage
This is the second most useful category after application usage. SRUM Network Usage tracks wired and wireless connections and the network SSID to which the asset is connected (when wireless). It also captures bandwidth usage in bytes sent and received by the application. Like other SRUM categories, these results include the application’s full path and the SID that executed it.
In case of a suspected data breach, this file can be used to see which applications transmitted the most data, whether sent or received.
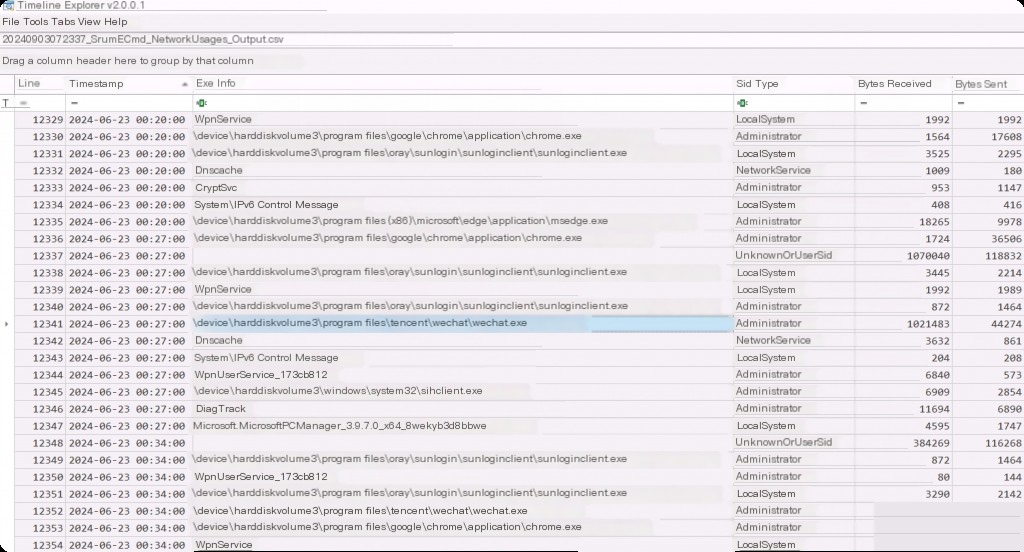
We can see the application ID (which can be used across SRUM data categories in multiple CSVs to track a particular application), timestamp, full path of the exe, the username that executed the application, and most importantly, the total bytes sent and received over the network.
Do not confuse this with the bytes read and written in the previous category. Here, these are the actual network bytes sent and received. These are very useful in data breach cases as we can easily spot applications transmitting large amounts of bytes when they shouldn’t be.
For example, if we find an exe named Notepad.exe transmitting large amounts of bytes, this is definitely suspicious and could be a case of process injection where malicious shellcode is injected into a legitimate Notepad process.