

1. Introduction
Previously, Brother Hong introduced and explained the startup interface of Wireshark. However, many beginners still find the Wireshark interface for capturing packets difficult to understand. In fact, it’s quite straightforward. Today, Brother Hong will write a separate article to provide a detailed introduction and explanation of the Wireshark capturing interface.
2. Overview of the Wireshark Packet Capture Interface
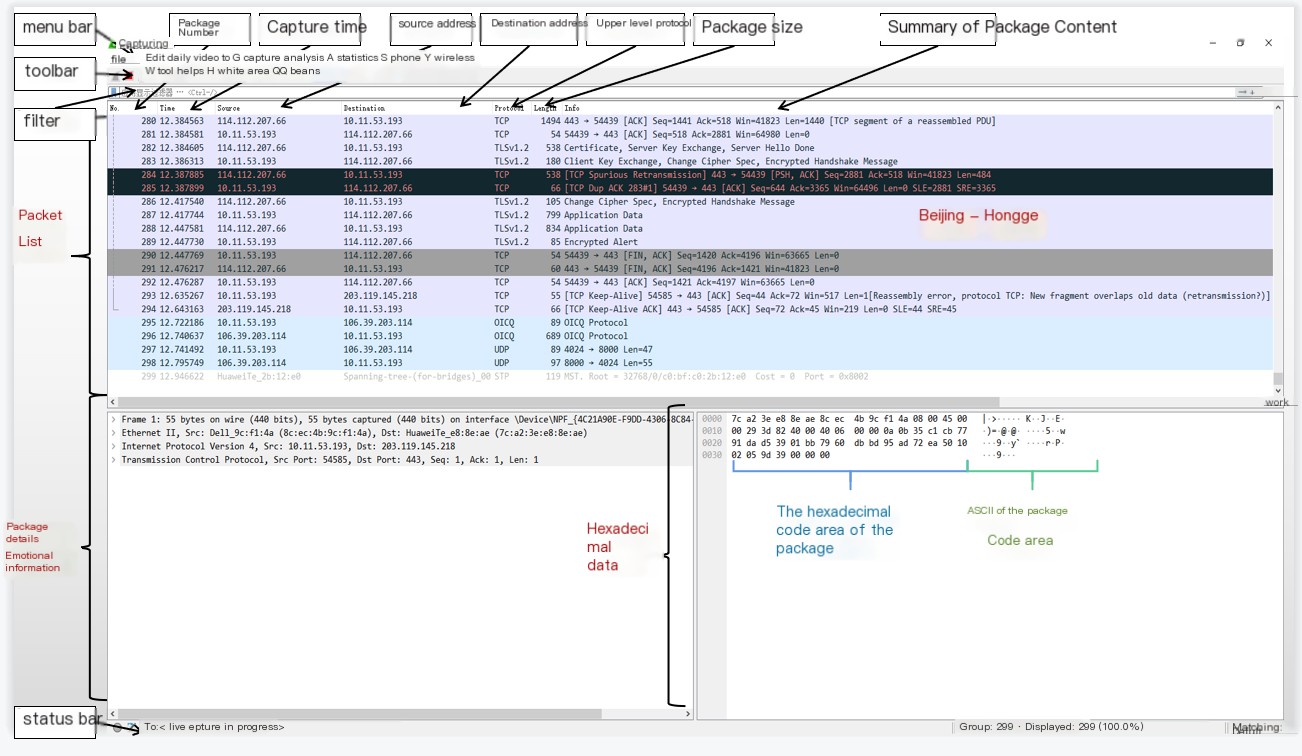
From the previous article, we know how to put Wireshark into packet capture mode to capture packets. The interface is displayed as shown in the figure below:
 />
/>
Wireshark network packet analysis software is mainly divided into these interfaces:
① Display Filter: Used for filtering.
② Packet List Pane: Displays captured packets, with source and destination addresses, and port numbers. Different colors represent different protocols of captured packets.
③ Packet Details Pane: Displays the fields within the packet.
④ Dissector Pane (Hexadecimal Data)
⑤ Miscellaneous (Address bar, miscellaneous items)
2.1 Display Filter
Display Filter is used to set filter conditions for listing filtered packets. Menu path: Analyze –> Display Filters. Display filters are used to search for content in captured records. Do not confuse capture filters with display filters. As shown in the figure below:
 />
/>
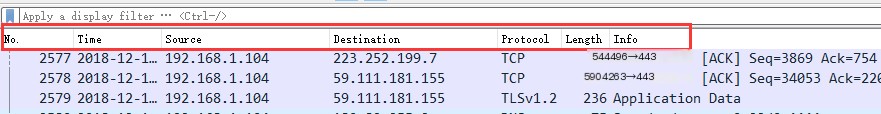
2.2 Packet List
Packet List Pane displays all captured data packets, each containing a number, timestamp, source address, destination address, protocol, length, and packet information. Different protocols use different colors to distinguish packets.
2.3 Packet Details
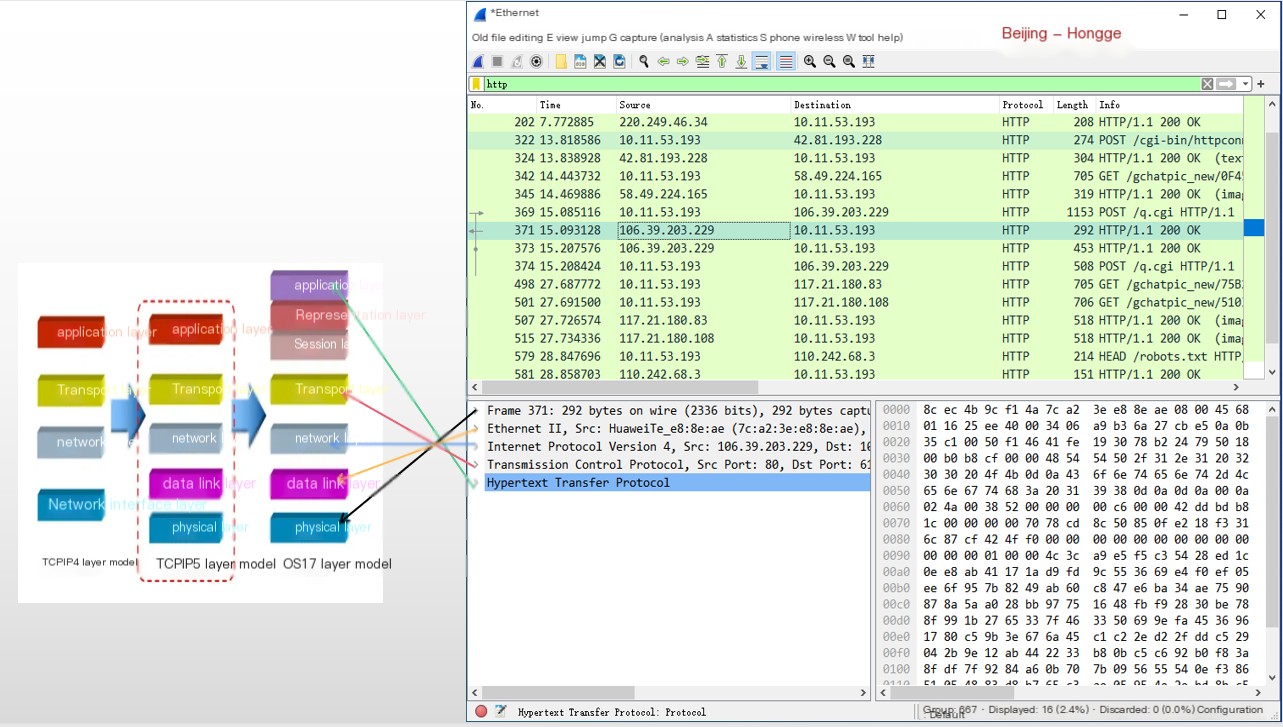
Packet Details Pane, in the packet list, when a specific packet is selected, shows all detailed content of the packet. The packet details panel is the most important, used to view each field in the protocol. Each line of information is as follows:
(1) Frame: Overview of the physical layer data frame
(2) Ethernet II: Header information of the data link layer Ethernet frame
(3) Internet Protocol Version 4: Header information of the internet layer IP packet
(4) Transmission Control Protocol: Header information of the transport layer segment, here it is TCP
(5) Hypertext Transfer Protocol: Information of the application layer, here it is the HTTP protocol
This shows that Wireshark parses HTTP protocol packets and presents the hierarchical structure of the HTTP protocol.
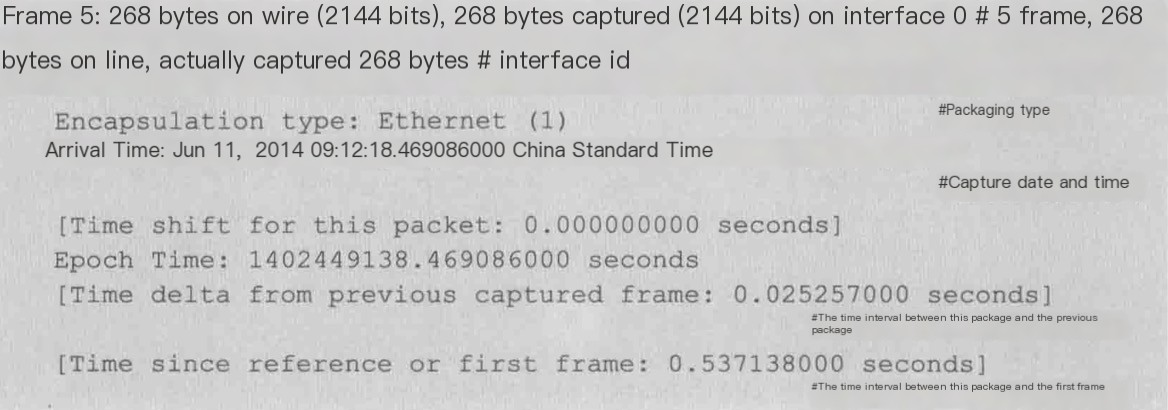
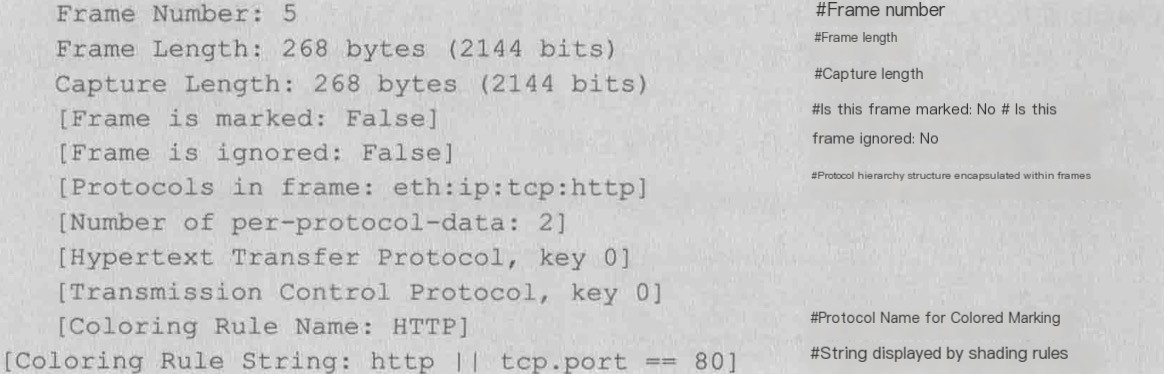
2.3.1 Frame
Overview of the physical layer data frame. As shown in the figure below:
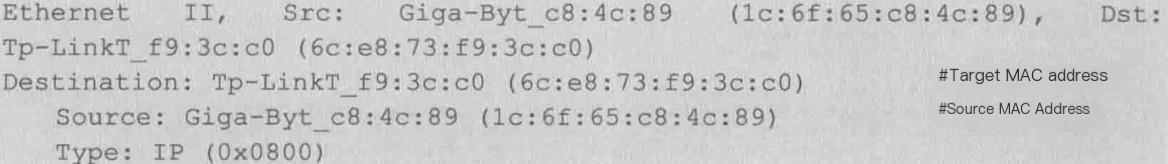
2.3.2 Ethernet II
Header information of the data link layer Ethernet frame. As shown in the figure below:
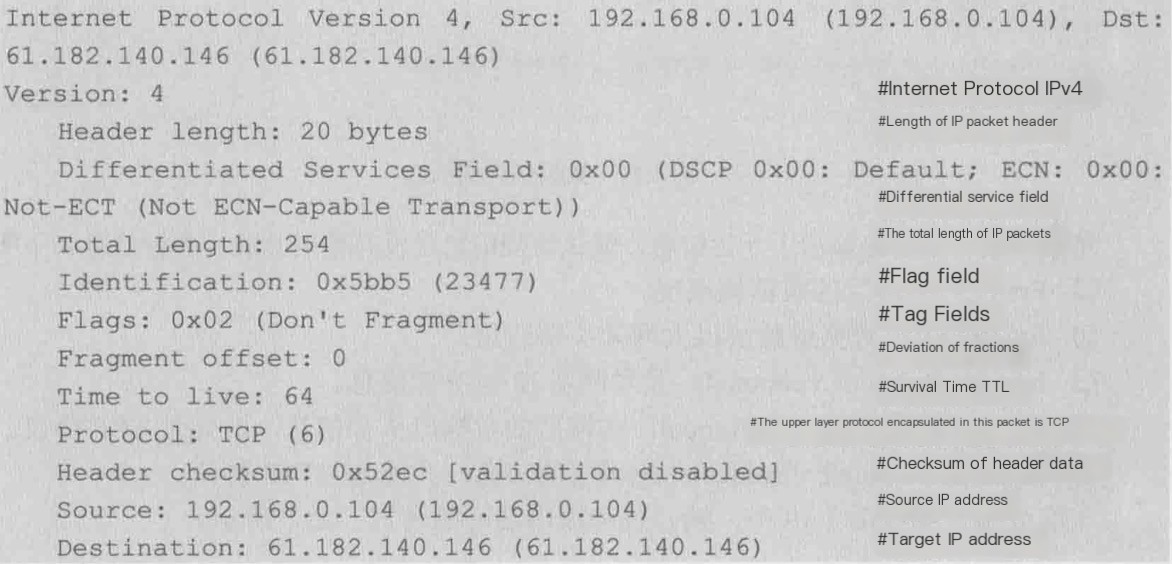
2.3.3 Internet Protocol Version 4
Header information of the internet layer IP packet. As shown in the figure below:
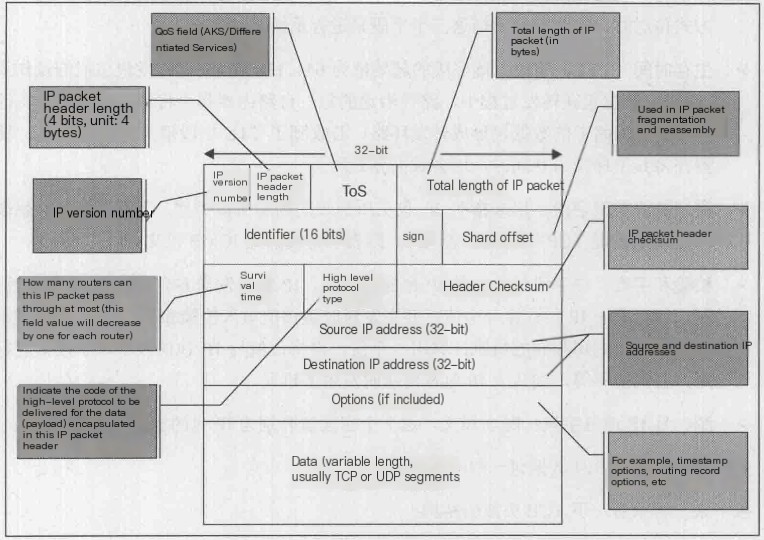
IP header. As shown in the figure below:
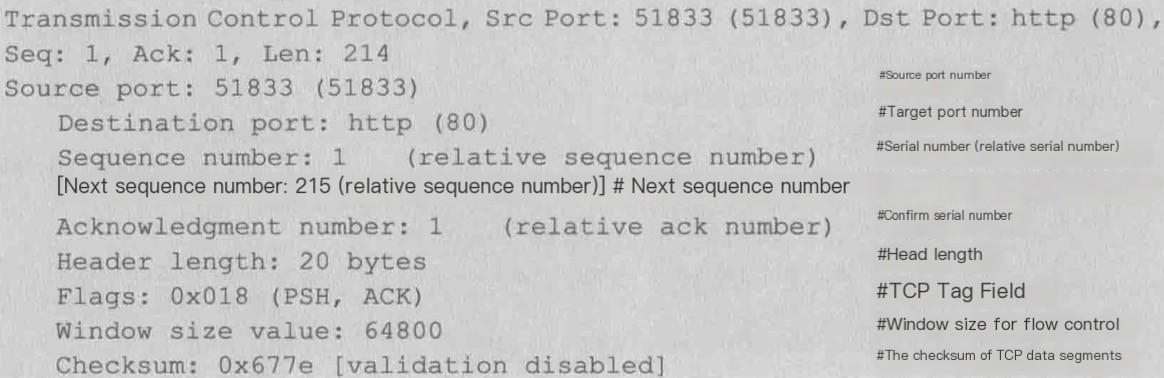
2.3.4 Transmission Control Protocol
Header information of the transport layer segment, here it is the TCP protocol. As shown in the figure below:
2.3.5 Hypertext Transfer Protocol
Application layer information, here it is the HTTP protocol.
2.4 Hexadecimal Data
Dissector Pane (Packet Byte View).
2.5 Status Bar
MISCELLANEOUS, mainly shows the packet file name, configuration file name, and the number of packets opened, and how many packets are currently displayed (e.g. after executing condition filtering, only packets matching the filter rules are displayed).
3. The OSI Model
3.1 OSI
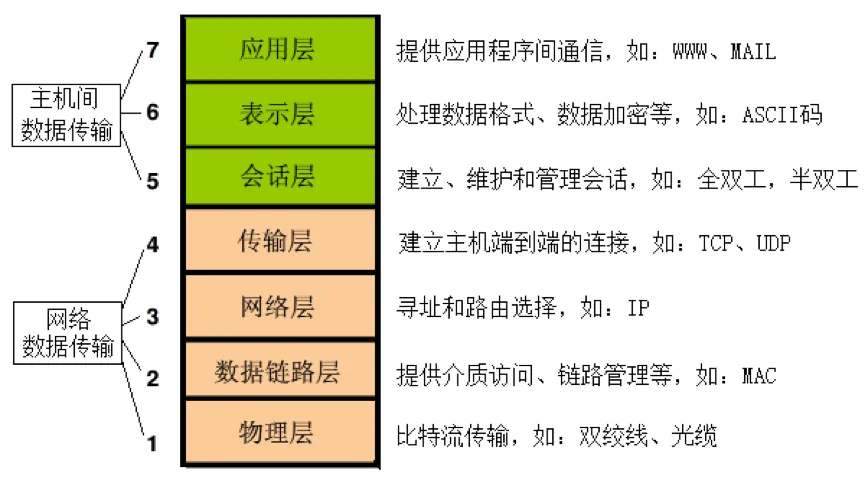
OSI is an open standard communication system interconnection reference model, with a well-defined protocol specification. The OSI model has a 7-layer structure, each layer can contain several sub-layers. The 7 OSI layers from top to bottom are: 7 Application Layer, 6 Presentation Layer, 5 Session Layer, 4 Transport Layer, 3 Network Layer, 2 Data Link Layer, 1 Physical Layer; where the upper layers (7, 6, 5, 4) define the functions of application programs, and the lower 3 layers (3, 2, 1) mainly deal with end-to-end, point-to-point data flow through the network.
3.2 Correspondence Between OSI and Packet Details
Let’s follow Brother Hong to see how each field in a network request packet captured by Wireshark corresponds to OSI. Take the HTTP protocol packet as an example to understand the hierarchical structure of the packet. Find an HTTP protocol packet in the Packet List panel. As shown in the figure below:
Analyzing the packet is to view the packet’s information. Expand each layer to see the corresponding information. For instance, to view data link layer information, expand the Ethernet II layer, and the information is shown as follows:
“`xmlEthernet II, Src: Tp-LinkT_46:70:ba (ec:17:2f:46:70:ba), Dst: Giga-Byt_17:cf:21 (50:e5:49:17:cf:21)Destination: Giga-Byt_17:cf:21 (50:e5:49:17:cf:21) # Destination MAC addressSource: Tp-LinkT_46:70:ba (ec:17:2f:46:70:ba) # Source MAC addressType: IPv4 (0x0800)“`
The displayed information includes the MAC addresses (physical addresses) of the sender and receiver of the packet.
A similar method can be used to analyze the hierarchical structure of other packets.
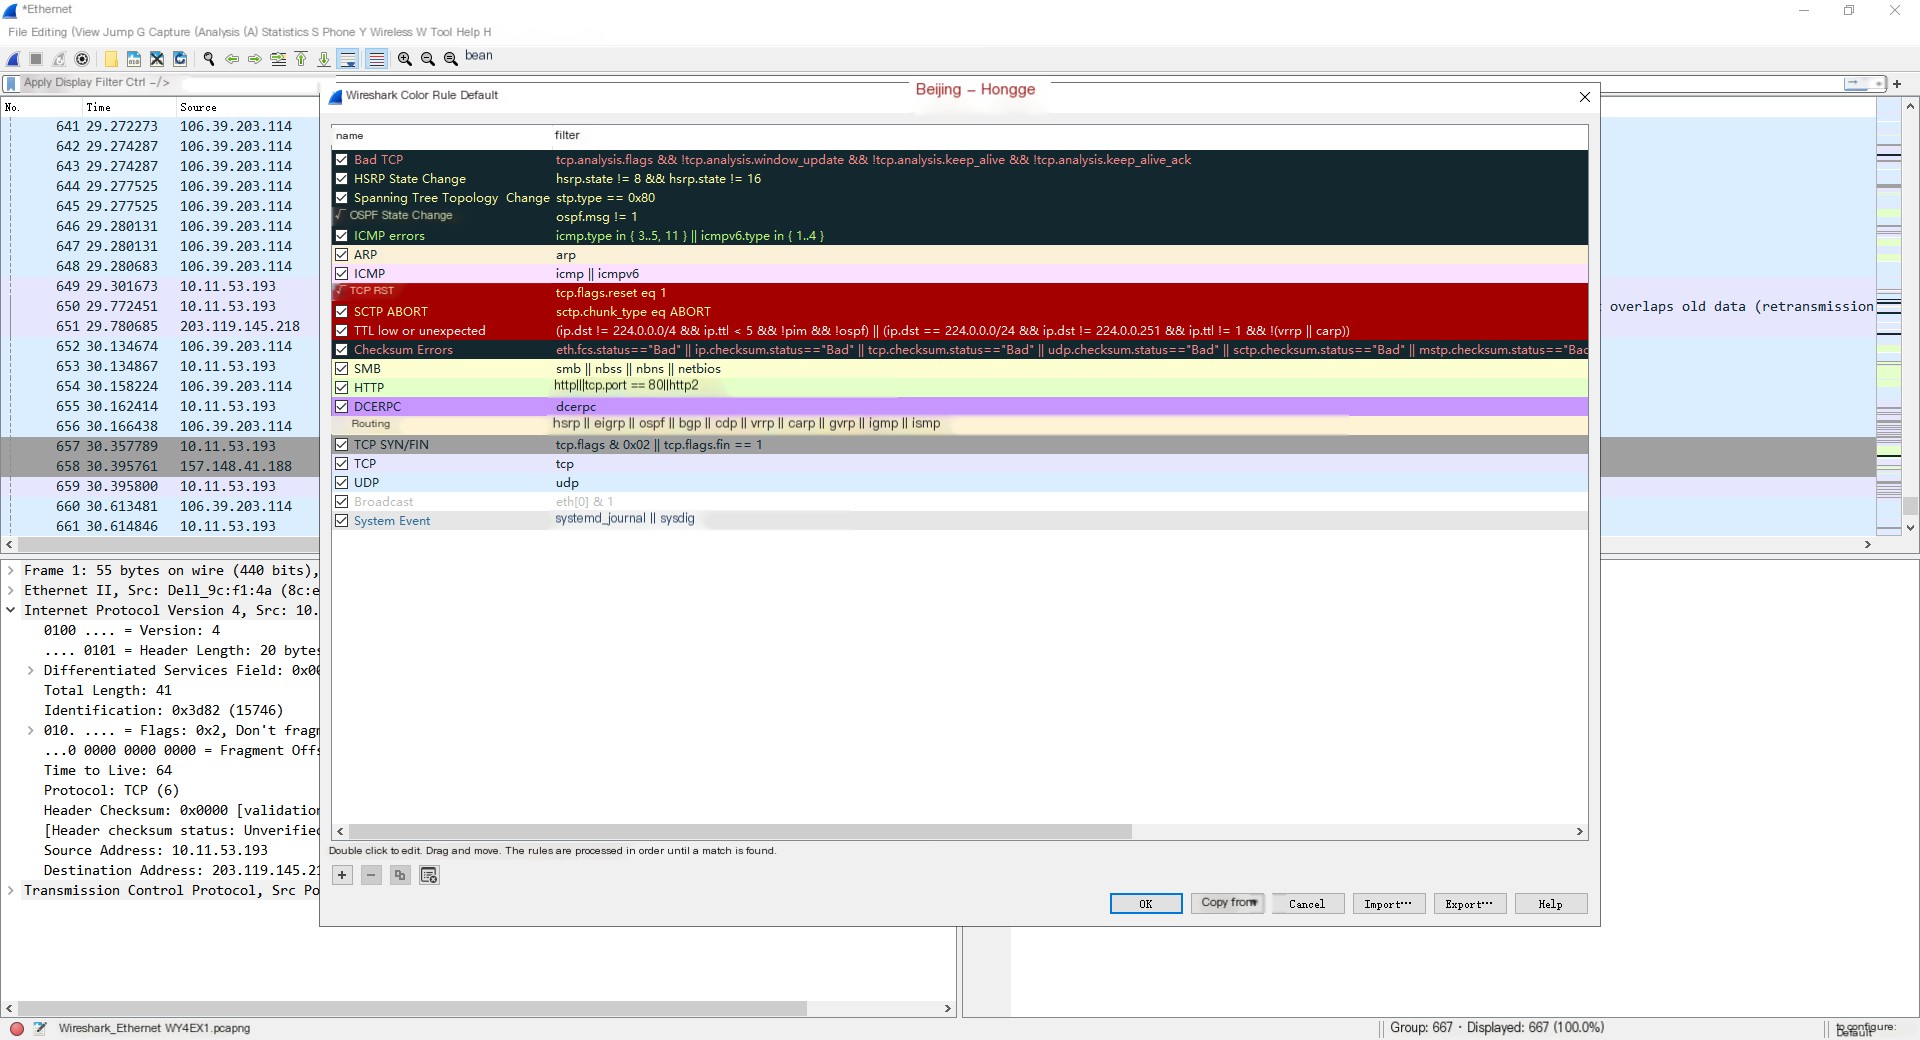
4. Distinguishing Network Protocols Captured by Wireshark with Colors
Explanation: Different network protocols in the packet list are distinguished using different colors.
The protocol color identification is located in the menu bar under View –> Coloring Rules. (View –> Coloring Rules) as shown in the figure below:
5. Summary
Alright, today’s focus is on the detailed explanation of the Wireshark packet capture interface. Brother Hong has concluded the explanation and sharing of the Wireshark packet capture interface. Isn’t it simple now? It’s getting late today, so we’ll stop here! Thank you for your patience in reading~~