
【Experiment Name】Network-Based Intrusion Detection System
【Experiment Objective】
1. Master the working mechanism of Snort IDS.
2. Apply Snort in three different working modes.
【Experiment Principle】
1. Overview of Snort IDS
Snort IDS (Intrusion Detection System) is a powerful network intrusion detection system. It has the ability to analyze real-time data traffic and record IP network packets. It can perform protocol analysis and search/match the content of network packets. It can detect various types of attacks and provide real-time alerts. Additionally, Snort is an open-source intrusion detection system with excellent scalability and portability.
2. Snort IDS Architecture
The architecture of Snort IDS is shown in Figure 10-1-1.
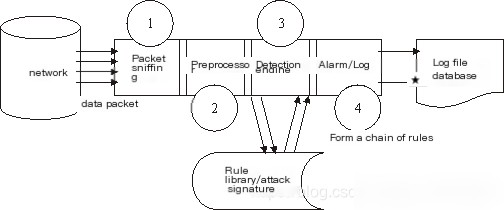
Figure 10-1-1 Snort IDS Architecture
As shown in the figure above, the structure of Snort consists of four main software modules:
(1) Packet Sniffing Module—Responsible for monitoring network packets and analyzing the network.
(2) Preprocessing Module—This module uses corresponding plugins to inspect raw packets and identify their “behavior,” such as port scanning or IP fragmentation. The packets are sent to the detection engine after preprocessing.
(3) Detection Module—This is the core module of Snort. When packets are passed from the preprocessor, the detection engine checks them against predefined rules. If the content of a packet matches a rule, it notifies the alert module.
(4) Alert/Log Module—The Snort data checked by the detection engine needs to be output in some way. If a rule in the detection engine is matched, an alert is triggered. This alert information can be sent to log files via the network, UNIX socket, Windows Popup (SMB), or SNMP protocol trap commands. It can also be sent to third-party plugins (e.g., SnortSam). Additionally, the alert information can be recorded in an SQL database.
3. Three Working Modes of Snort
Snort has three basic functionalities: sniffer, packet logger, and intrusion detection. The sniffer mode simply reads packets from the network and displays them continuously on the terminal. The commonly used command is `snort -dev`. The packet logger mode records packets to the hard disk, and the commonly used command is `snort -b`. The network intrusion detection mode is the most complex and configurable. It allows Snort to analyze network traffic and match it against user-defined rules, taking certain actions based on the detection results.
4. Snort Rules
Definition of Snort Rules
Snort uses a simple rule description language that is easy to extend and quite powerful. Snort rules are text-based, and rule files are categorized into different groups. For example, the file `ftp.rules` contains rules related to FTP attacks.
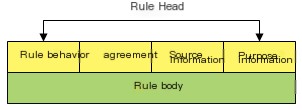
Figure 10-1-2 Snort Rule Header
【Experiment Content】
1. Packet Sniffing, Logging, and Simple Alerts
In this task, hosts A and B form one group, C and D form another, and E and F form the third group.
First, use “Snapshot X” to restore the Linux system environment. 1. Snort Packet Sniffing 1. Start Snort Enter the experiment platform, click the “Console” button on the toolbar, navigate to the IDS working directory, and run Snort to monitor the network interface `eth0` with the following requirements:
(1) Capture only ICMP echo request packets sent by hosts in the same group.
(2) Display detailed information about the link layer and application layer of the packets on the terminal.
(3) Log the captured information to the directory `/var/log/snort`.
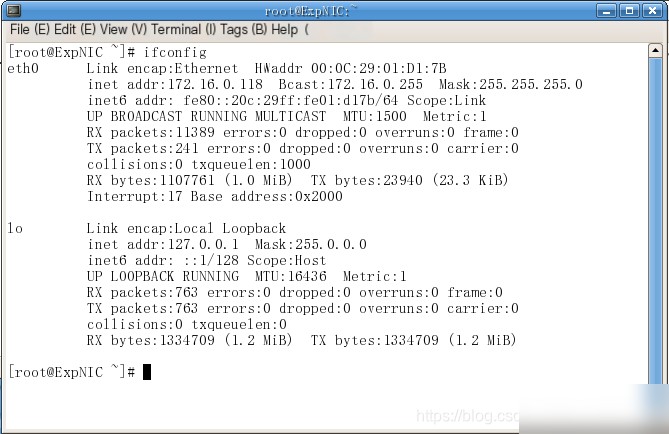
Since the IP address may have issues after restoring the snapshot, reconfigure the IP address to: 172.16.0.118
Run Snort to monitor the network interface `eth0`
Snort command__snort -ieth0 devt icmp and src 172.l6.0.119 -1 /var/1og/snor
Execute the above command on the local machine, and have the host in the same group ping the current host. Fill in Table 10-1-1 based on the information captured by Snort.
It is worth noting that since all the lab computers restore the same snapshot, the MAC addresses written into the virtual machines are identical.
|
Source MAC of Data Frame |
0:C:29:1:D1:7B |
|
Destination MAC of Data Frame |
0:C:29:1:D1:7B |
|
IP Upper Layer Protocol Type |
ICMP |
|
Source IP of Packet |
172.16.0.119 |
|
Destination IP of Packet |
172.16.0.118 |
|
Total Packet Length |
0x62 |
|
IP Header Length |
20 |
|
ICMP Header Length |
8 |
|
ICMP Payload Length |
56 |
|
ICMP Type/Code |
8/0 |
2. View Snort Log Records. [Note] By default, the last-level directory of Snort log records is named after the source IP of the triggering packet. Use the key combination Ctrl+C to stop Snort.
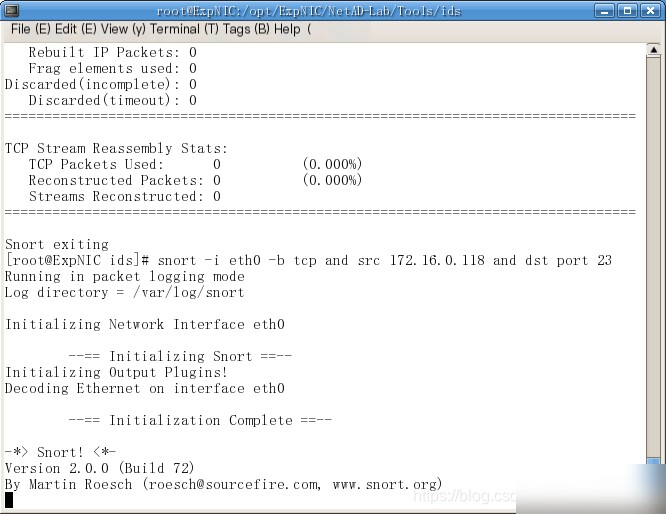
2. Snort Packet Logging
(1) Monitor the network interface `eth0`, capture only Telnet request packets sent by hosts in the same group, and store the captured packets in binary format in the log file `/var/log/snort/snort.log`.
Snort command snort -i eth0 -b tcp and src 172.16.0.118 and dst port 23
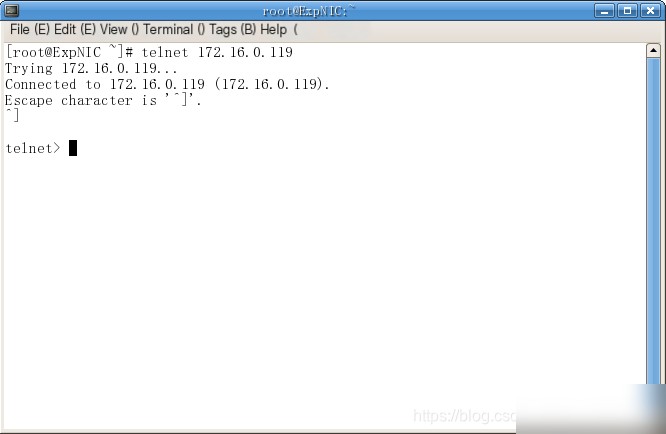
(2) Execute the above command on the current host, and have the host in the same group perform a Telnet remote login to the current host (username: guest, password: guestpass).
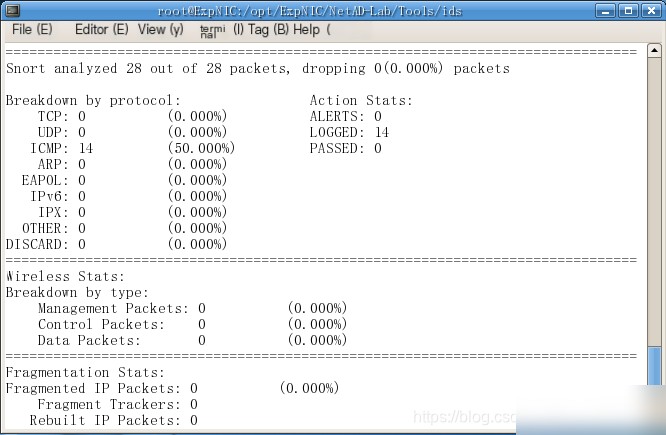
(3) Stop Snort capture (Ctrl+C), read the `snort.log` file, and view the packet content.
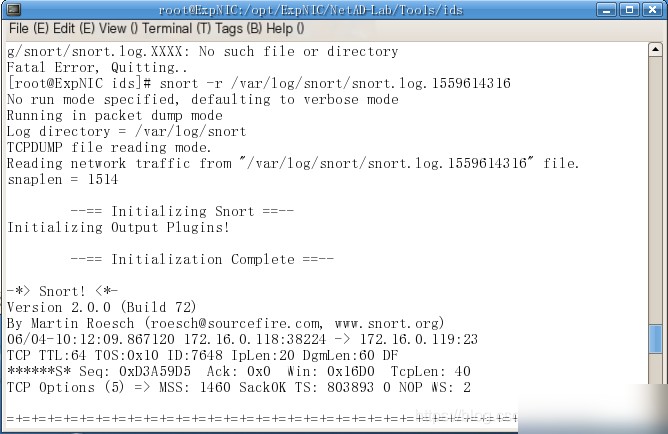
Snort command snort -r /var/1og/snort/snort.log.1559614316
3. Simple Alert Rules
(1) Create a new Snort rule set file `new.rules` in the Snort rule set directory `ids/rules`, and configure it to alert on request packets from external hosts targeting the current host’s port 80/tcp. Customize the alert message.
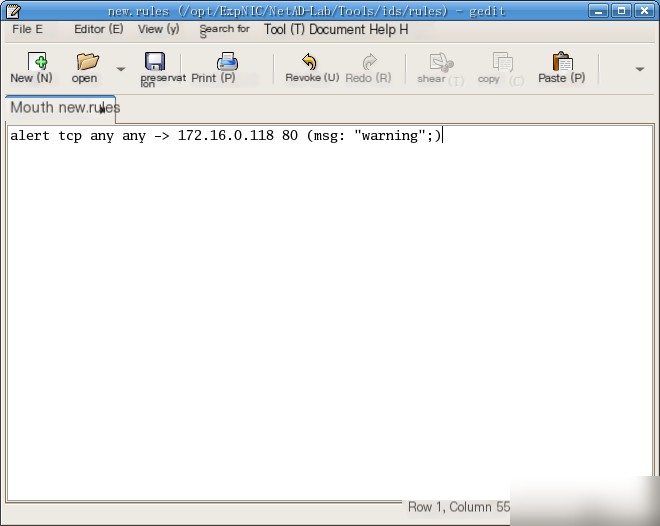
Snort command alert tcp any any -> 172.16.0.118 80 (msg: “warning”;)
Complete Table 10-1-2 based on the rule.
|
Snort Rule Action |
Alert |
|
Rule Header Protocol |
TCP |
|
Rule Header Source Info |
Any IP, Any Port |
|
Rule Header Destination Info |
172.16.0.118 80 |
|
Direction Operator |
Current Host as Receiver |
|
Alert Message |
Warning |
(2) Edit the `snort.conf` configuration file to include the `new.rules` rule set file. Specifically, use the `vim` (or `vi`) editor to open `snort.conf`, switch to edit mode, and add a new line at the end to include the rule set file `new.rules`.
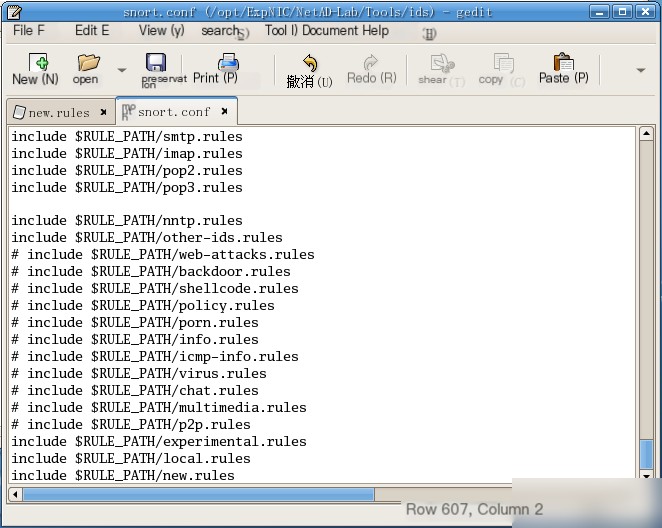
Add the statement to include the `new.rules` rule set fileinclude $RULES_PATH/new.rules
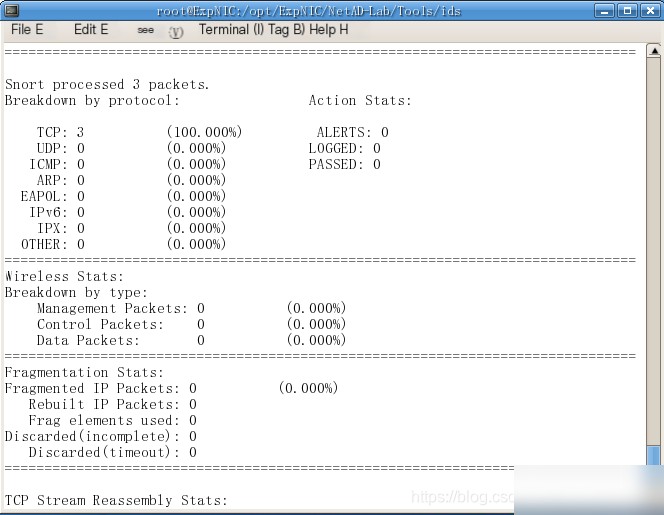
(3) Start Snort in intrusion detection mode and begin monitoring.
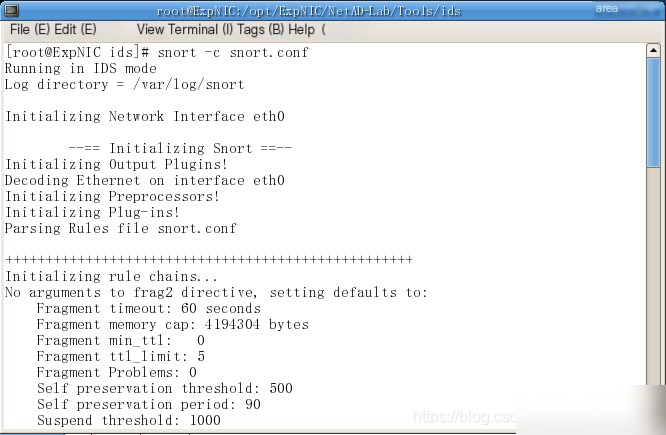
Command to start Snort snort -c snort.conf
Start Snort in intrusion detection mode, and have the host in the same group access the current host’s web service.
Complete Table 10-1-3 based on the alert log (`/var/log/snort/alert`).
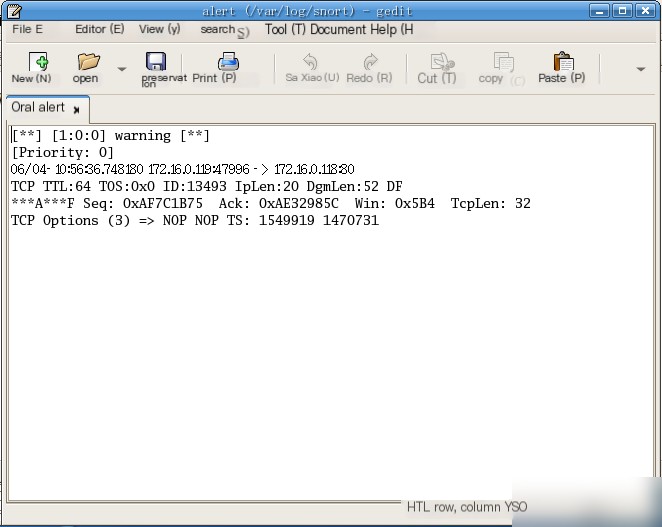
|
Alert Name |
Warning |
|
Source IP of Packet |
172.16.0.119 |
|
Destination IP of Packet |
172.16.0.118 |
|
Source Port of Packet |
47996 |
|
Destination Port of Packet |
80 |
2. String Matching and Port Scan Attacks
In this task, hosts A and B form one group, C and D form another, and E and F form the third group.
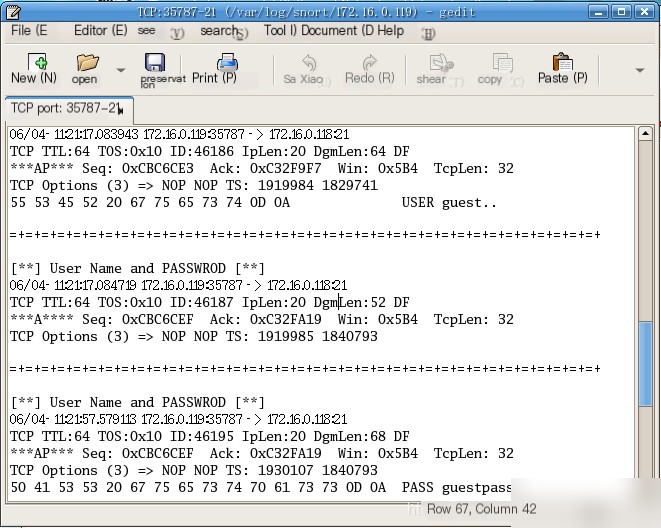
1. String Matching Note: The FTP service, upon receiving an FTP request (target port 21/tcp) from a client, will inform the client of the FTP software and version it is using in the response packet. Fedora Core 5 uses the FTP server software `vsFTPd 2.0.4`. In other words, when data transmitted over the network contains the string “vsFTPd,” it is highly likely that an FTP user is remotely logging into an FTP server on Linux. By using an intrusion detection system to match network packets containing the string “vsFTPd,” subsequent packets can be recorded. If the FTP session is conducted in plaintext, these packets may contain the username and password used for login.
(1) Create a new Snort rule set file `new2.rules` in the Snort rule set directory `/opt/ExpNIC/NetAD-Lib/Tools/ids/rules` to alert on communications involving `vsFTPd` in the network. Capture the FTP client’s login username and password immediately after the FTP server declares its identity.
(2) Use `activate/dynamic` rules to implement this.
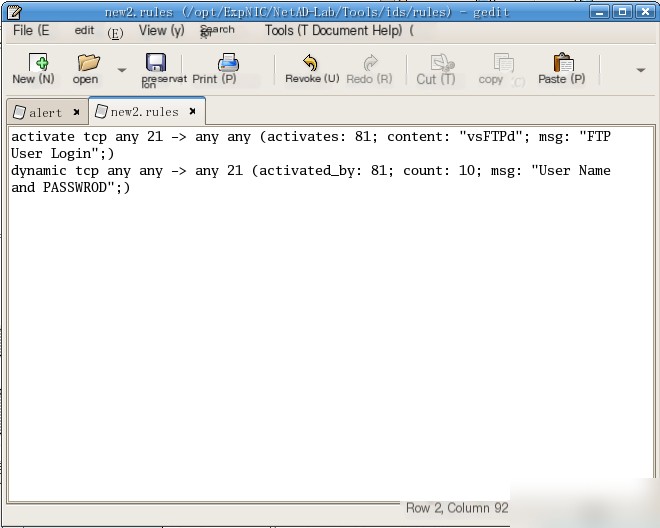
Snort rule activate tcp any 21 -> any any (activates: 81; content: “vsFTPd”; msg: “FTP User Login”;) dynamic tcp any any -> 21 (activated_by:81; count:10; msg: “User Name and PASSWORD”;)
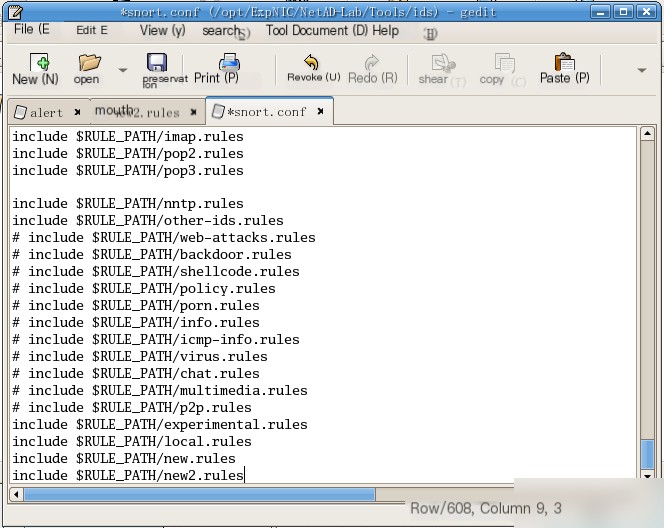
(3) Edit the `snort.conf` configuration file to include the `new2.rules` rule set file.
(4) Start Snort in intrusion detection mode and begin monitoring. Note: The FTP username and password data in the network transmission are application-layer (ISO seven-layer protocol) data. By default, Snort does not display or record application-layer data. Therefore, when starting Snort, specify that it should capture and record application-layer data.
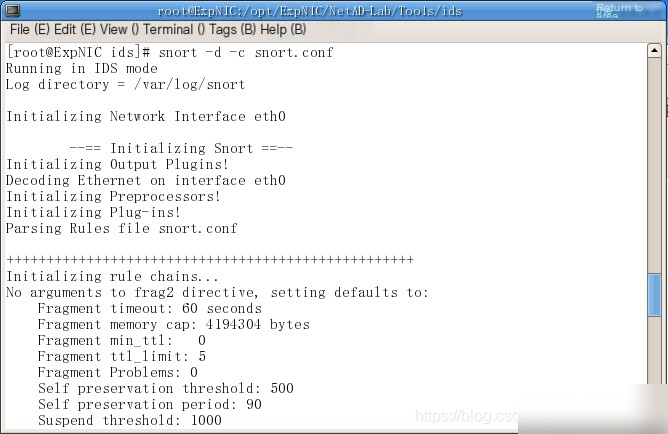
Command to start Snort snort -d -c snort.conf
Have the host in the same group perform a remote FTP login. The login process is shown in the figure below.
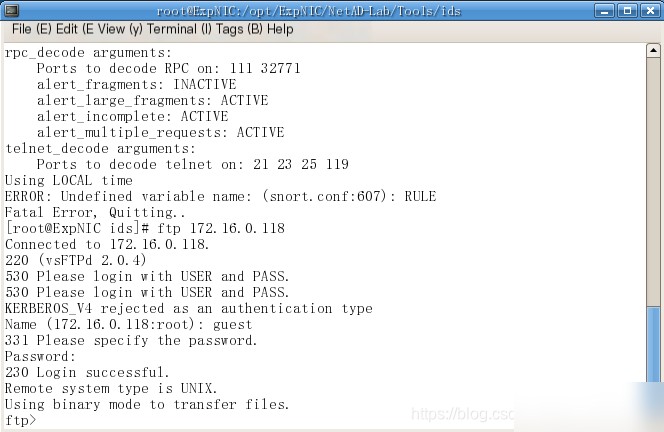
[Note] Username: guest, Password: guestpass. View the alert log to extract the username and password used during the FTP client’s login.
2. Port Scan Attack Detection
(1) Modify the Snort configuration file `snort.conf` to enable the port scan preprocessor. Start Snort in intrusion detection mode to detect port scanning behavior from external sources.
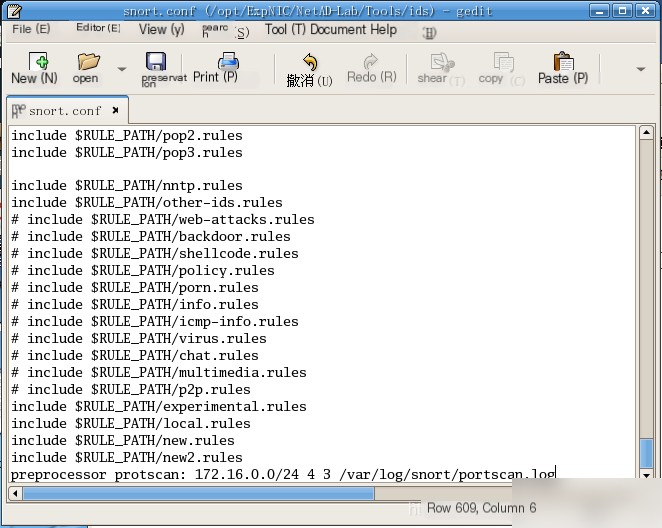
Preprocessor Description: preprocessor protscan: 172.16.0.0/24 4 3 /var/log/snort/portscan.log
(2) Use Nmap (`/opt/ExpNIC/NetAD-Lab/Tools/portscan/namp`) on the host in the same group to perform a TCP port scan on the current host.
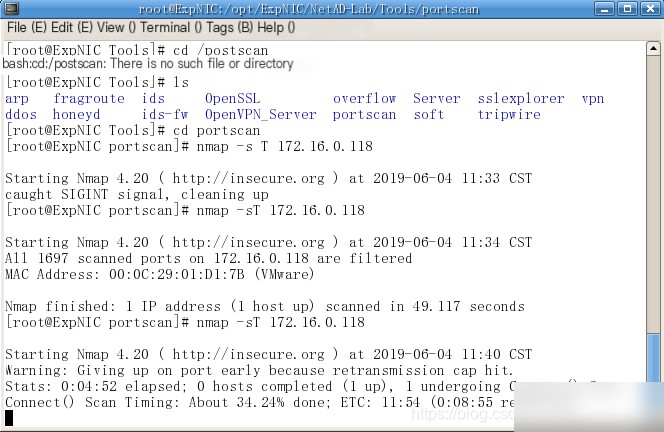
After the port scan is complete, view the `portscan.log` alert log and answer the following questions.
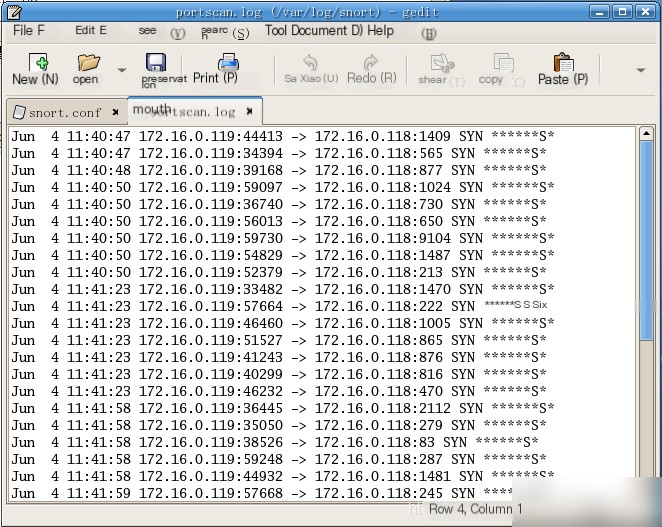
Portscan.log log record format description: Date Time Source IP:Source Port -> Destination Host IP:Scanned Port SYN S* By default, when Nmap performs a TCP port scan on the target host, the scanning order is: Unordered (Ordered/Unordered).
【Summary or Discussion】
Overall, this experiment was not very difficult. There was a statement in the IP configuration file for automatic IP address assignment that we had not noticed, which caused the IP address we specified to be unusable and wasted a lot of time. After commenting out this statement, the experiment proceeded more smoothly. However, possibly due to issues with the lab machines, the packet loss rate was still quite high.
The main content of the experiment was learning Snort commands. Snort has five predefined rule actions, and the ones used in the experiment include: `log`—records packets in a user-defined format; `alert`—records packets in a user-defined format and triggers an alert; `dynamic`—remains in a dormant state until triggered by an `activate` rule, after which it records packets like the `log` action; `activate`—generates an alert when triggered by a rule and activates related `dynamic` rules, often used for detecting complex attacks or classifying data.