

Introduction to Java Heap and GC Principles
The Java Heap is divided into the Young Generation and the Old Generation, known in the diagram as the New Generation and Tenured Generation, for storing object instances.
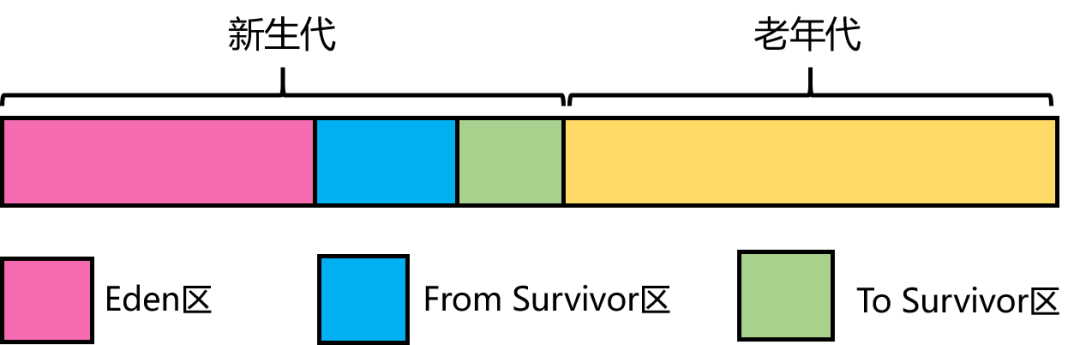
The new generation is divided into three areas: one Eden and two Survivor spaces – From Survivor (abbreviated as S0) and To Survivor (abbreviated as S1). The default ratio among them is 8:1:1. Additionally, the default ratio between the new generation and the old generation is 1:2. Typically, when a new object is created, the newly generated object instance is placed into Eden. During garbage collection, the objects in Eden that are not collected are moved into one of the Survivor spaces, let’s say Survivor0.
Then empty Eden, so now Eden is empty, and Survivor0 contains object instances still in use, while Survivor0 is empty. The next time collection occurs, the objects still in use in Eden will be placed into Survivor0, and the objects in Survivor0 that need to be collected will be marked and cleared. Finally, the entire Survivor0 is copied to Survivor1, and then Survivor0 is cleared.
After numerous cycles of garbage collection, if certain objects are consistently in use and cannot be collected, it’s assumed that these object instances are likely to remain in use indefinitely. Therefore, they are moved to the old generation. This approach ensures that during the mark-sweep-copy process in the young generation, these objects won’t be involved, saving a considerable amount of time. This is because garbage collection is frequently executed in the young generation, while the old generation undergoes collection only when specific conditions are met.
Java Heap: Young Generation
- All newly created objects are initially placed in the young generation. The goal of the young generation is to quickly collect objects with short life cycles as efficiently as possible.
- The new generation memory is divided into one Eden space and two Survivor spaces (Survivor0, Survivor1) in an 8:1:1 ratio. Typically, there’s one Eden space and two Survivor spaces. Most objects are initially created in the Eden space. During garbage collection, the live objects from the Eden space are copied to the Survivor0 space, allowing the Eden space to be cleared. When the Survivor0 space also becomes full, the live objects from both the Eden and Survivor0 spaces are transferred to the other Survivor1 space, after which the Eden and Survivor0 spaces are cleared. At this point, Survivor0 is empty, and then Survivor0 and Survivor1 spaces are swapped, ensuring that Survivor1 remains empty. This process repeats iteratively.
- When survivor1 area is insufficient to store the live objects from eden and survivor0, these live objects are directly stored in the old generation. If the old generation also fills up, a Full GC is triggered, which means both the young and old generations undergo garbage collection.
- The Garbage Collection (GC) occurring in the young generation is also called Minor GC. Minor GC happens quite frequently (and it doesn’t necessarily trigger only when the Eden space is full).
Old Generation in Java Heap
- During a YGC (Young Garbage Collection), when the Survivor space is insufficient to accommodate the surviving objects, those objects will directly move to the Old Generation.
- After several Young Garbage Collections (YGC), if the age of a surviving object reaches the set threshold (default is 15), it will be promoted to the old generation.
- Dynamic age determination rule: In the To Survivor space, if objects of the same age collectively occupy more than half of the space, then objects older than this age will be moved directly to the old generation without needing to reach the default generational age.
- Large Object: Controlled by the -XX:PretenureSizeThreshold startup parameter. If the object size exceeds this value, it will bypass the Young Generation and be directly allocated in the Old Generation.
Java Heap: Permanent Generation
Used for storing static files such as Java classes and methods. The Permanent Generation does not significantly impact garbage collection, but some applications may dynamically generate or invoke some classes, such as Hibernate. In such cases, it is necessary to set a relatively large Permanent Generation space to store these newly added classes during execution.
When is YGC triggered?
In most cases, objects are directly allocated in the Eden space of the Young Generation. If there isn’t enough space in the Eden area, it triggers a YGC (Minor GC). The YGC process only handles the Young Generation. Since the majority of objects can be reclaimed in a short period, after YGC, only a small number of objects survive and are moved to the S0 area (utilizing the copy algorithm).
When the next Young Garbage Collection (YGC) is triggered, the live objects in the Eden space and S0 space are moved to the S1 space, and the Eden space and S0 space are then cleared. When YGC is triggered again, it processes the areas of the Eden space and S1 space (i.e., S0 and S1 swap roles). With each YGC cycle, the age of the surviving objects increases by one.
When is the FGC triggered?Hello! It looks like your message is empty. If you need
- When objects promoted to the old generation exceed the remaining space of the old generation, an FGC (Major GC) is triggered. The FGC process includes both the new generation and the old generation.
- When the memory usage in the old generation reaches a certain threshold (which can be adjusted via parameters), it directly triggers a Full Garbage Collection (FGC).
- Space allocation guarantee: Before the Young Generation Collection (YGC), it’s crucial to check whether the largest available contiguous space in the old generation is greater than the total space of all objects in the young generation. If it’s less, this indicates that YGC is unsafe. In such cases, the system will check whether the parameter `HandlePromotionFailure` is set to allow promotion failure. If it does not allow, then a Full GC will be triggered immediately. If it does allow, the system will further check if the largest available contiguous space in the old generation is greater than the average size of objects promoted to the old generation in past instances. If this is also less, it will trigger a Full GC.
- Metaspace will expand when there is insufficient space, and when it expands to the value specified by the -XX:MetaspaceSize parameter, it will also trigger a Full Garbage Collection (FGC).
- When `System.gc()` or `Runtime.gc()` is explicitly called, it triggers a Full Garbage Collection (FGC).
Under what circumstances can Garbage Collection (GC) impact the program?
Regardless of whether it’s YGC or FGC, they will inevitably cause a certain level of program stutter (also known as the Stop-The-World problem: when the GC thread starts working, other work threads are suspended). Even when using more advanced garbage collection algorithms like ParNew, CMS, or G1, these only reduce the stutter duration and do not completely eliminate it.
Under what circumstances will GC impact the program? From most to least severe, I believe the following four situations are included:
- Frequent FGC: Typically, FGC is relatively slow, ranging from a few hundred milliseconds to several seconds. Under normal circumstances, FGC should execute once every few hours or even days, which is generally acceptable in terms of system impact. However, if FGC occurs frequently (such as every few minutes), it indicates a problem. This can cause worker threads to be frequently stopped, making the system appear constantly laggy and degrading the overall performance of the program.
- YGC takes too long: Generally, the total time consumed by YGC in tens or hundreds of milliseconds is relatively normal. Although it might cause the system to stall for a few milliseconds or tens of milliseconds, this situation is almost imperceptible to the user and has a negligible impact on the program. However, if YGC takes up to 1 second or even several seconds (almost as long as FGC), then the stalling time will increase. Coupled with the frequent occurrence of YGC itself, this can lead to a significant number of service timeout issues.
- Extended FGC Duration: When FGC takes longer, stutter duration also increases, particularly affecting high concurrency services. This can lead to numerous timeout issues during the FGC, thereby reducing availability. This issue requires attention as well.
- YGC Occurs Too Frequently: Even if YGC does not cause service timeouts, having YGC occur too frequently can reduce the overall performance of the service. This is something that should be monitored, especially for high-concurrency services.
Java, despite having a Garbage Collector (GC), can still experience memory leak issues.
1. The use of static collection classes such as HashMap and Vector is most likely to cause memory leaks.
2. Various connections, such as database connections, network connections, and IO connections, are not explicitly closed or shown to call `close`, leading to memory leaks because they are not reclaimed by the garbage collector (GC).
3. The use of listeners can also lead to memory leaks if they are not properly removed when objects are released.
Differences Between Memory Leak and Memory Overflow
1. Memory Leak (memory leak)
Applying for memory without freeing it, for instance, if there is a total of 1024M of memory, and you’ve allocated 521M of memory that is never reclaimed, then only 521M of usable memory remains, as if a portion has leaked. To put it colloquially, a memory leak is akin to “occupying the toilet without using it.”
2. Memory Overflow (out of memory)
If you have more content or specific HTML structure you’d like me to work with, feel free to share!
When requesting memory, there is not enough memory available for use;
To put it simply, imagine a restroom with three stalls, and two people are just standing there without leaving (memory leaks). This leaves only one stall available, causing the restroom to be under significant stress. Suddenly, two more people come in, and there aren’t enough stalls (memory) available. The memory leak then escalates into a memory overflow.
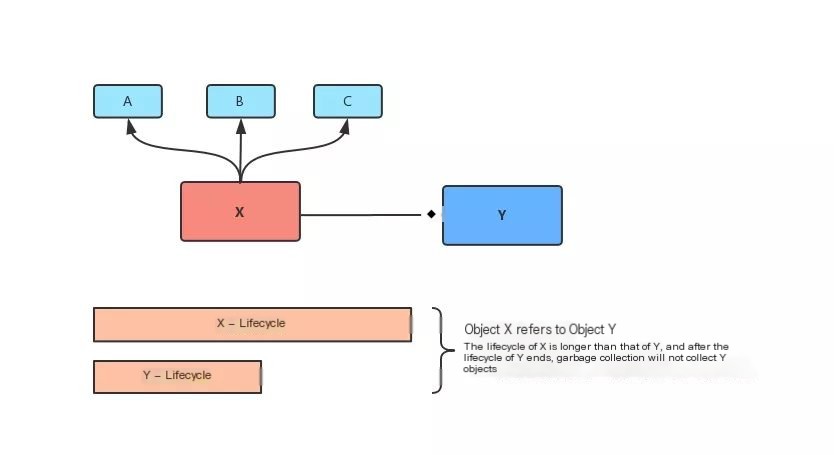
Object X references object Y, and X’s lifecycle is longer than Y’s lifecycle; thus, when Y’s lifecycle ends, X still holds a reference to Y. At this point, the garbage collector will not reclaim object Y. If object X also references the shorter-lived objects A, B, and C, and object A further references objects a, b, and c, this could lead to a situation where a significant number of obsolete objects remain uncollected. Consequently, these objects consume memory resources, potentially leading to a memory leak and eventually causing memory overflow.
It is evident that the relationship between memory leaks and memory overflow is such that an increase in memory leaks will eventually lead to memory overflow.
Notice: Anonymous inner classes hold a reference to the outer class, which can potentially lead to memory leaks, whereas static inner classes do not.https://mp.weixin.qq.com/s/ZX-BvkQ4B7ql62Mi8v_rLwIt seems like you’ve submitted an empty message or a character that I can’t translate. Please provide the text you’d like me to assist with, and I’ll
Check JVM Configuration, Set Java Heap Size
Use the following command to view the JVM startup parameters:
ps aux | grep "applicationName=adsearch"The heap memory is seen to be 4G, with the young generation at 2G and the old generation also at 2G. The young generation uses the ParNew collector, while the old generation employs the concurrent mark-sweep (CMS) collector. A full garbage collection (FGC) occurs when the memory occupancy rate of the old generation reaches 80%.
-Xms4g -Xmx4g -Xmn2g -Xss1024K
-XX:ParallelGCThreads=5
-XX:+UseConcMarkSweepGC
-XX:+UseParNewGC
-XX:+UseCMSCompactAtFullCollection
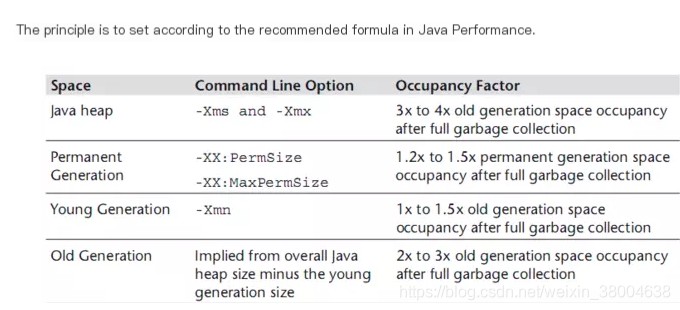
-XX:CMSInitiatingOccupancyFraction=80For setting the entire Java heap size, configure Xmx and Xms to be 3-4 times the size of the surviving objects in the old generation after a Full GC, that is, 3-4 times the memory usage of the old generation post-Full GC.
Set PermSize and MaxPermSize to be 1.2-1.5 times the size of the live objects in the old generation.
The setting for the Young Generation Xmn should be 1 to 1.5 times the size of the surviving objects in the Old Generation.
The old generation’s memory size is set to be 2-3 times the size of the surviving objects in the old generation.
Xms = Xmx = (3-4) (size of the old generation after full GC)

Xmn = (1-1.5) (size of the old generation after full GC)
Add GC Logs in JVM Parameters
-XX:+PrintGC  -XX:+PrintGCDetails
or
-verbose:gc -XX:+PrintGCDetails -XX:+PrintGCDateStamps -XX:+PrintGCTimeStamps
The GC log will record the memory size of each generation after each FullGC, and observe the space size after the old generation GC. You can observe the memory situation after FullGC for a period of time (such as 2 days), and estimate the size of surviving objects in the old generation after FullGC based on the space size data of the old generation after multiple FullGCs (you can take the average value based on the memory size after multiple FullGCs)
[GC (Allocation Failure) [PSYoungGen: 228290K->3505K(244224K)] 264814K->43652K(506368K), 0.0368352 secs] [Times: user=0.14 sys=0.00, real=0.04 secs]
Based on the gc log, we can roughly infer whether youngGC and fullGC are too frequent or take too long, so as to prescribe the right medicine. We will analyze the G1 garbage collector below, and we recommend that you use G1-XX:+UseG1GC.
YoungGC is too frequent
Frequent youngGC usually means that there are many short-term small objects. First consider whether the Eden area/new generation is set too small, and see if the problem can be solved by adjusting the -Xmn, -XX:SurvivorRatio and other parameter settings. If the parameters are normal, but the young GC frequency is still too high, you need to use Jmap and MAT to further investigate the dump file.
YoungGC takes too long
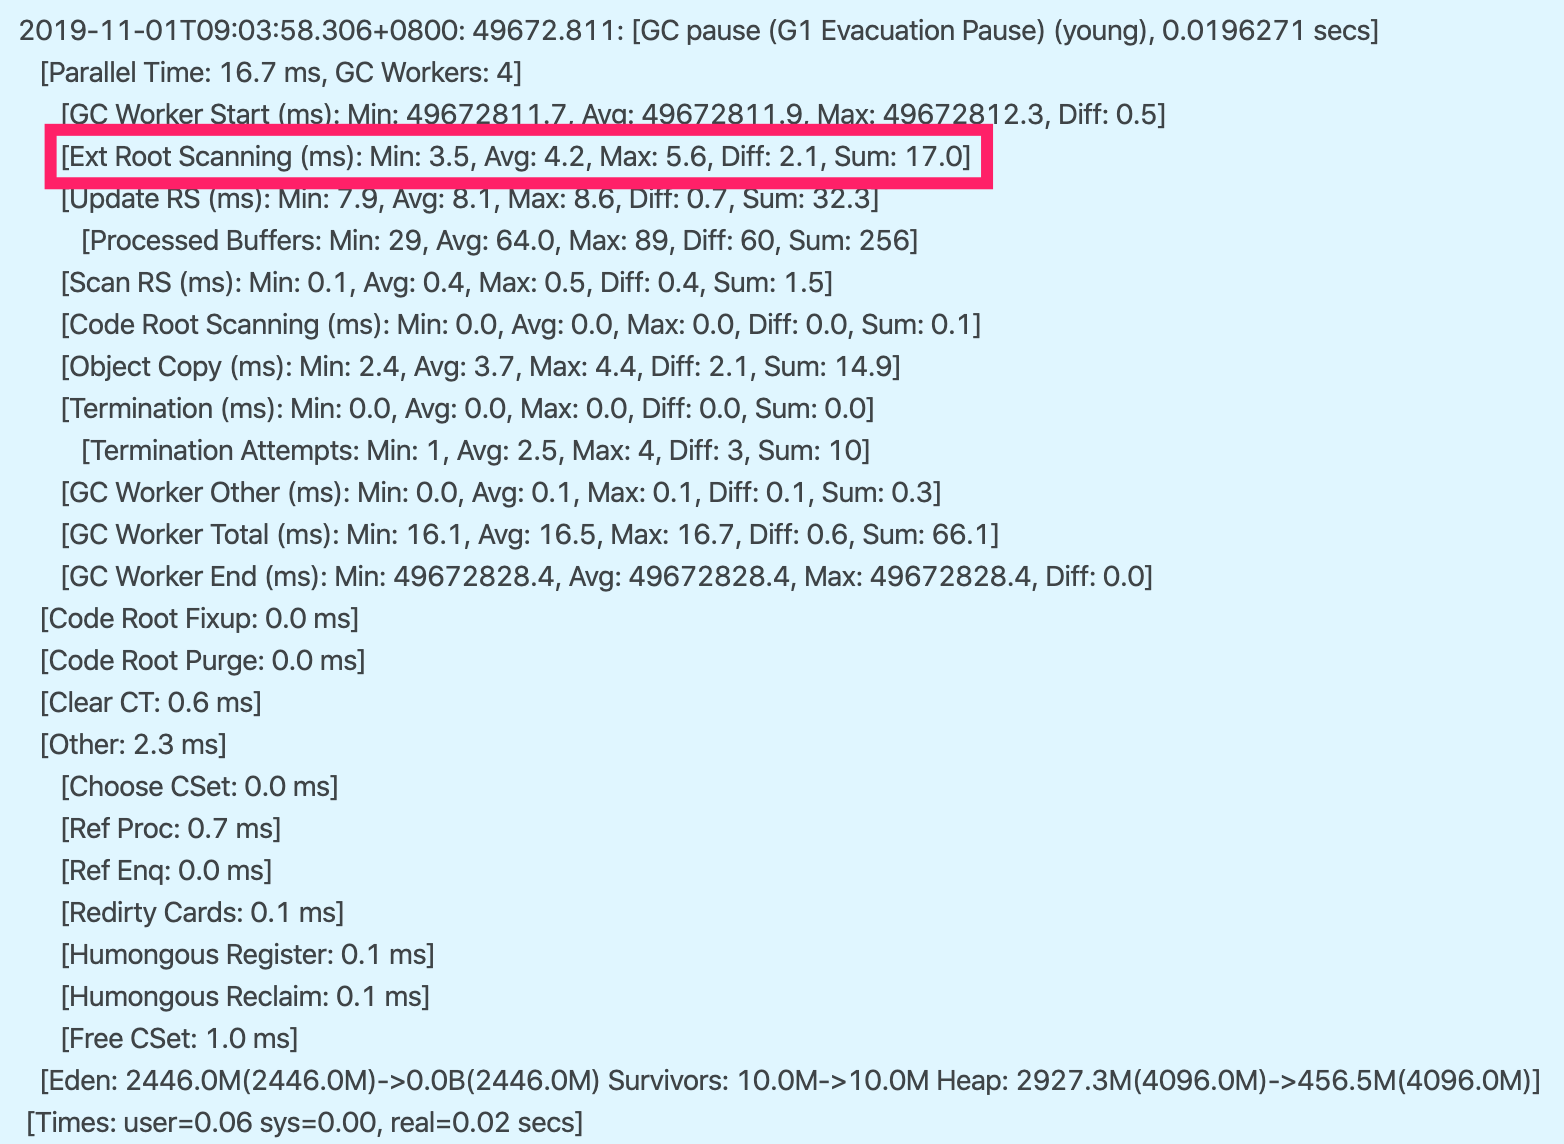
The problem of too long time depends on where the time is spent in the GC log. Taking the G1 log as an example, you can pay attention to the Root Scanning, Object Copy, Ref Proc and other stages. If Ref Proc takes a long time, you need to pay attention to the referenced objects. If Root Scanning takes a long time, you need to pay attention to the number of threads and cross-generational references. Object Copy needs to pay attention to the object life cycle. Moreover, the time analysis needs to be compared horizontally, that is, compared with the time of other projects or normal time periods. For example, if the Root Scanning in the figure increases significantly compared to the normal time period, it means that too many threads are started.
Trigger full GCMore often in G1, it’s about mixed GC, but you can troubleshoot mixed GC using the same approach as young GC. If a full GC is triggered, there generally is an issue. G1 will fall back to using the Serial collector to perform garbage collection, which can result in pause times reaching several seconds, essentially bringing the system to its knees.
The causes of full GC may include the following, along with some thoughts on parameter adjustments:
- Concurrent Phase Failure: During the concurrent marking phase, if the old generation is filled up before the MixGC, G1 will then abandon the marking cycle. In such situations, it might be necessary to increase the heap size or adjust the number of concurrent marking threads.
-XX:ConcGCThreads。 - Promotion failure: During GC (Garbage Collection), there wasn’t enough memory available for surviving/promoted objects, which triggered a Full GC. At this point, you can address this issue by…
-XX:G1ReservePercentTo increase the reserved memory percentage, reduce-XX:InitiatingHeapOccupancyPercentInitiate the marking in advance,-XX:ConcGCThreadsIt is also possible to increase the number of labeled threads. - Large Object Allocation Failure: When a large object cannot find a suitable region space for allocation, a full GC occurs. In such cases, you can increase memory or enlarge…
-XX:G1HeapRegionSize。 - Don’t randomly invoke System.gc(): Just avoid doing it unnecessarily.
Additionally, we can configure it in the startup parameters.-XX:HeapDumpPath=/xxx/dump.hprofPlease dump the files related to full GC and perform dumps before and after GC using jinfo.
jinfo -flag +HeapDumpBeforeFullGC pid
jinfo -flag +HeapDumpAfterFullGC pid
In this way, you get 2 dump files. After comparison, focus mainly on the problematic objects that have been garbage collected to pinpoint the issue.
2. Steps for Troubleshooting Java Heap FGC Issues
1. Clearly understand from a programming perspective, what are the causes of Full Garbage Collection (FGC)?
- Large Object: The system loaded too much data into memory at once (for example, SQL queries without pagination), causing the large object to enter the old generation.
- Memory leak: A large number of objects are frequently created but cannot be reclaimed (for example, IO objects not calling the close method to release resources after use), initially triggering frequent garbage collection (FGC), and eventually leading to an OutOfMemoryError (OOM).
- Programs frequently generate long-lived objects, and when these objects survive beyond the generational cutoff age, they transition to the old generation, ultimately triggering a Full Garbage Collection (FGC), as exemplified in this article.
- The bug in the program caused the dynamic generation of numerous new classes, leading to continuous Metaspace occupation, which initially triggered Full Garbage Collection (FGC) and eventually resulted in an OutOfMemoryError (OOM).
- The code explicitly calls the `gc` method, including in your own code and even within the framework’s code.
- JVM Parameter Configuration Issues: Including total memory size, the size of the young and old generations, the size of the Eden space and S space, metaspacesize, garbage collection algorithms, and more.
2. What tools can be used to clearly troubleshoot issues?
- Large objects: The system loads too much data into memory at one time (for example, SQL queries are not paginated), causing large objects to enter the old generation.
- Memory leaks: A large number of objects are frequently created, but cannot be recycled (for example, the close method is not called after the IO object is used to release resources), which first triggers FGC and finally leads to OOM.
- The program frequently generates some objects with long life cycles. When the survival age of these objects exceeds the generation age, they will enter the old generation and finally trigger FGC. (That is, the case in this article)
- Program BUGs cause many new classes to be dynamically generated, causing Metaspace to be constantly occupied, first triggering FGC and finally leading to OOM.
- The gc method is explicitly called in the code, including your own code and even the code in the framework.
- JVM parameter setting issues: including total memory size, the size of the new generation and the old generation, the size of the Eden area and the S area, the size of the metaspace, the garbage collection algorithm, etc.
3. Commands for Checking Java Heap GC Status
a. Check the Maximum Java Heap Usage for a Specific Process
PID refers to the Process ID, 20 denotes the top twenty, instances indicate the number of instances, and bytes represent the memory usage size (1M=1024KB, 1KB=1024Bytes).
jmap -histo pid | head -n 20b. Monitor Java Heap Memory and Check Full GC Frequency
Monitor the JVM, print every 5 seconds, loop 100 times.
jstat -gc pid 5000 100
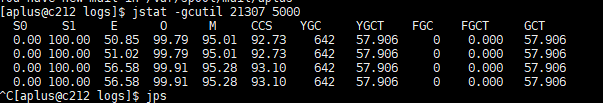
jstat -gcutil pid 5000 100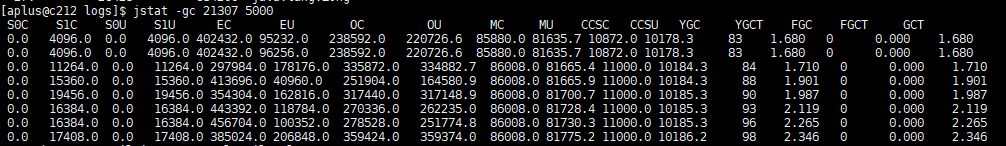
- S0C: The size of the first survivor space
- S1C: Size of the Second Survivor Space
- S0U: Usage size of the first survivor space
- S1U: Usage Size of the Second Survivor Space
- EC: Size of the Eden Area
- EU: Usage Size of the Eden Zone
- OC: Old Generation Size
- OU: Old Generation Usage Size
- MC: Method Area Size
- Method Area: Usage Size
- CCSC: Reducing Compression Class Space Size
- CCSU: Space Usage Size for Compression Classes
- YGC: Young Generation Garbage Collection Count
- YGCT: Time Consumption of Young Generation Garbage Collection
- FGC: Number of Full Garbage Collections in the Old Generation
- FGCT: Time Consumption of Old Generation Garbage Collection
- GCT: Total Garbage Collection Time
Check the process runtime, frequency = duration / FGC
It looks like you're working with process information on a Unix-like system. The command you used, `ps -eo pid,tty,user,comm,lstart,etime | grep 24019`, is filtering the process list to find details about a specific process with the PID 24019.

Here's a breakdown of the output:

- **PID (Process ID):** 24019
- **TTY (Terminal Type):** ?
- **User:** admin
- **Command:** java
- **Start Time:** Thu Dec 13 11:17:14 2018
- **Elapsed Time:** 01:29:43

This means that the process with ID 24019 is a Java application started by the user 'admin' on December 13, 2018, at 11:17:14 AM, and it has been running for 1 hour, 29 minutes, and 43 seconds.

If you have any specific questions or need further assistance, feel free to ask!
4. Troubleshooting Guide for Java Heap
- Check the monitoring to understand the time when the problem occurred and the current FGC frequency (you can compare it with the normal situation to see if the frequency is normal)
- Understand whether there were any programs launched or basic component upgrades before this time point.
- Understand the parameter settings of the JVM, including: the size settings of each area of the heap space, which garbage collectors are used for the new generation and the old generation, and then analyze whether the JVM parameter settings are reasonable.
- Then use the elimination method for the possible reasons listed in step 1, among which the full metaspace, memory leaks, and explicit calls to the gc method in the code are relatively easy to troubleshoot.
- For FGC caused by large objects or objects with long life cycles, you can use the jmap -histo command and combine it with the dump heap memory file for further analysis. You need to locate the suspicious object first.
- Locate the specific code through the suspicious object for further analysis. At this time, you need to combine the GC principle and the JVM parameter settings to figure out whether the suspicious object meets the conditions for entering the old generation before you can draw a conclusion.
5. Locating and Analyzing Memory Overflow
Memory overflow is often encountered in actual production environments. For example, continuously writing data into a collection, encountering an infinite loop, or reading an extremely large file can all potentially cause memory overflow.
In the event of a memory overflow, the first step is to pinpoint the phase where the memory overflow occurred and conduct an analysis to determine whether it is a normal or abnormal situation. If it is a legitimate requirement, consider increasing the memory allocation. If it is an abnormal requirement, then code modifications are necessary to fix the bug.
First, we must learn how to identify the problem before we proceed with the analysis. To locate issues, we need to utilize tools like jmap and MAT for precise analysis.
1. Simulate Memory Overflow
Write code to add one million strings to a List collection, with each string composed of 1000 UUIDs. If the program executes correctly, print “ok” at the end.
package com.zn;
import java.util.ArrayList;
import java.util.List;
import java.util.UUID;
public class TestJvmOutOfMemory {
public static void main(String[] args) {
List
Next, let's see how to set the full connection and semi-connection queue sizes:
The size of the full connection queue depends on min(backlog, somaxconn). Backlog is passed in when the socket is created, and somaxconn is an OS-level system parameter. The size of the semi-connection queue depends on max(64, /proc/sys/net/ipv4/tcp_max_syn_backlog).
In daily development, we often use servlet containers as servers, so sometimes we also need to pay attention to the size of the container's connection queue. In tomcat, backlog is called acceptCount, and in jetty it is acceptQueueSize.
RST exception
The RST packet indicates a connection reset, which is used to close some useless connections. It usually indicates an abnormal closure, which is different from four waves.
In actual development, we often see connection reset / connection reset by peer errors, which are caused by RST packets.
Port does not exist
If a SYN request to establish a connection is sent to a non-existent port, the server will directly return a RST message to terminate the connection if it finds that it does not have this port.
Actively replace FIN to terminate the connection
Generally speaking, normal connection closure needs to be implemented through FIN messages, but we can also use RST messages instead of FIN to indicate direct connection termination. In actual development, the SO_LINGER value can be set to control it. This is often intentional to skip TIMED_WAIT and provide interaction efficiency. Use it with caution if it is not idle.
An exception occurs on one side of the client or server, and the other side sends RST to inform the other side to close the connection
The TCP queue overflow and sending RST packets mentioned above actually belongs to this type. This is often due to some reasons that one party can no longer process the request connection normally (such as the program crashes, the queue is full), thereby informing the other party to close the connection.
The received TCP message is not in the known TCP connection
For example, one machine lost the TCP message due to the bad network, and the other party closed the connection. Then after a long time, the previously missing TCP message was received, but because the corresponding TCP connection no longer exists, a RST packet will be directly sent to open a new connection.
One party has not received the confirmation message from the other party for a long time, and sends a RST message after a certain period of time or retransmission times
This is mostly related to the network environment. A poor network environment may cause more RST messages.
It was mentioned before that too many RST messages will cause program errors. Reading operations on a closed connection will report connection reset, and writing operations on a closed connection will report connection reset by peer. Usually we may also see broken pipe errors, which are errors at the pipeline level, indicating that reading and writing on a closed pipeline often continue to read and write data after receiving RST and reporting connection reset errors. This is also introduced in the glibc source code comments.
How do we determine the existence of RST packets when troubleshooting? Of course, use the tcpdump command to capture packets and use wireshark for simple analysis. tcpdump -i en0 tcp -w xxx.cap, en0 represents the monitored network card.