

Hello everyone, I’m Lanpanzi. There are many reasons why requests may be slow. When the frontend appears to be slow, but the backend logs indicate that the processing time is not slow, it can often be confusing. In such cases, especially when dealing with network issues, it’s important to remember that it’s time to perform a packet capture analysis. How do we generally analyze slow requests using packet capture files, particularly focusing on TCP packet latency? Let’s explore this today.
Packet Capture File Analysis
I plan to use a packet captured in the testing environment for analysis. First, execute the packet capture command.
The -w command allows me to save the captured packets on the server to a file named http.pcap. Then, I dump this file from the server and use Wireshark to analyze it.
TCP Delta Time
First, let’s take a look at the attributes related to TCP packets and latency.
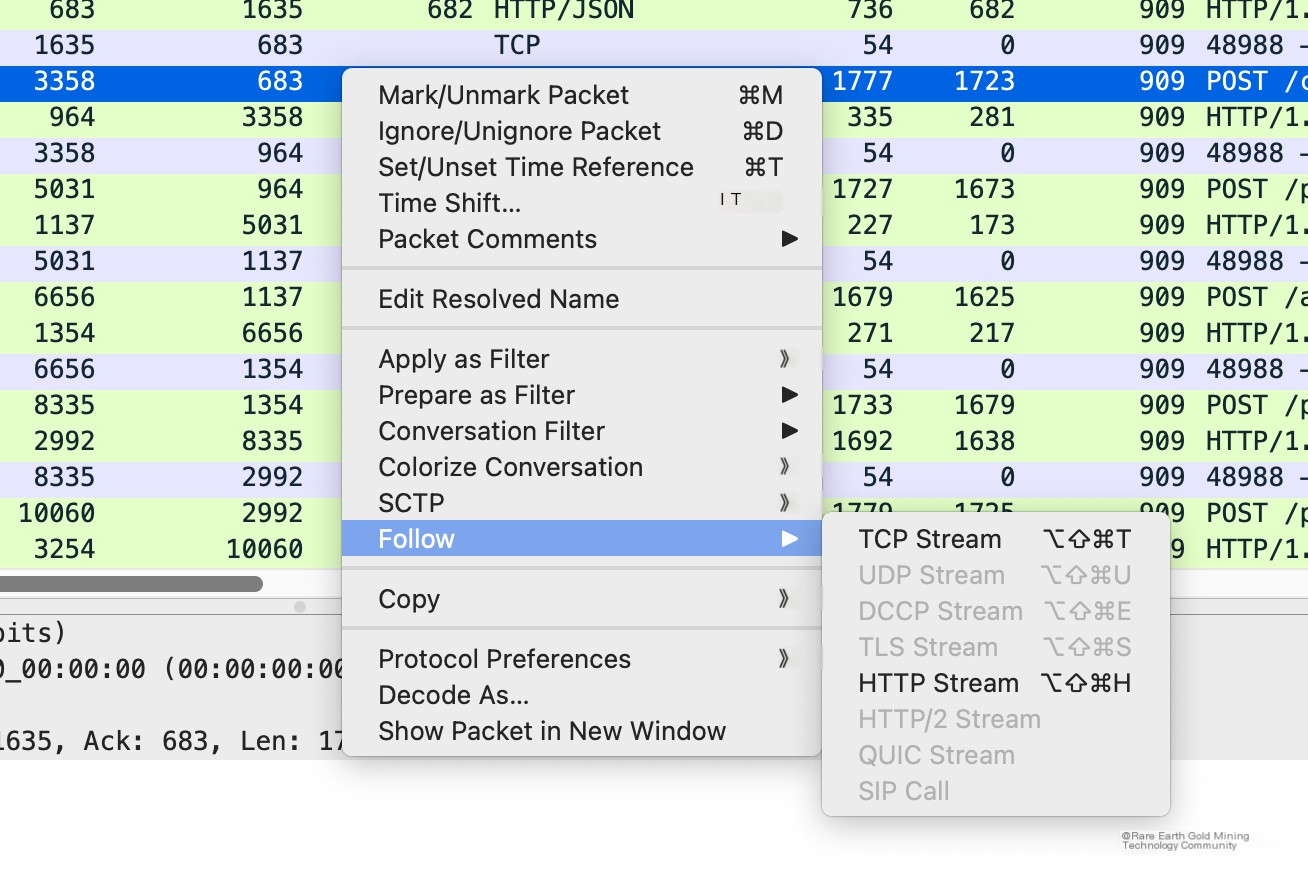
Follow a TCP stream.
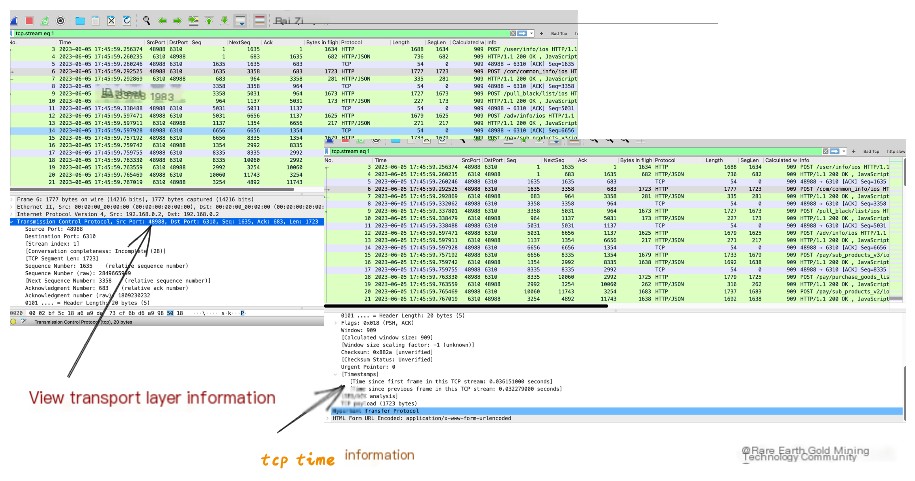
Relevant time information for TCP is in the transport layer. Clicking to view reveals two columns:
Time since first frame indicates how long this TCP packet is from the first TCP packet in this TCP stream.
Time since previous frame indicates how long this TCP packet is from the previous TCP packet.
We can also set Time since previous frame as a custom column and then sort by this time to identify packets with significant delays from the transport layer’s perspective.
The operation is as follows:
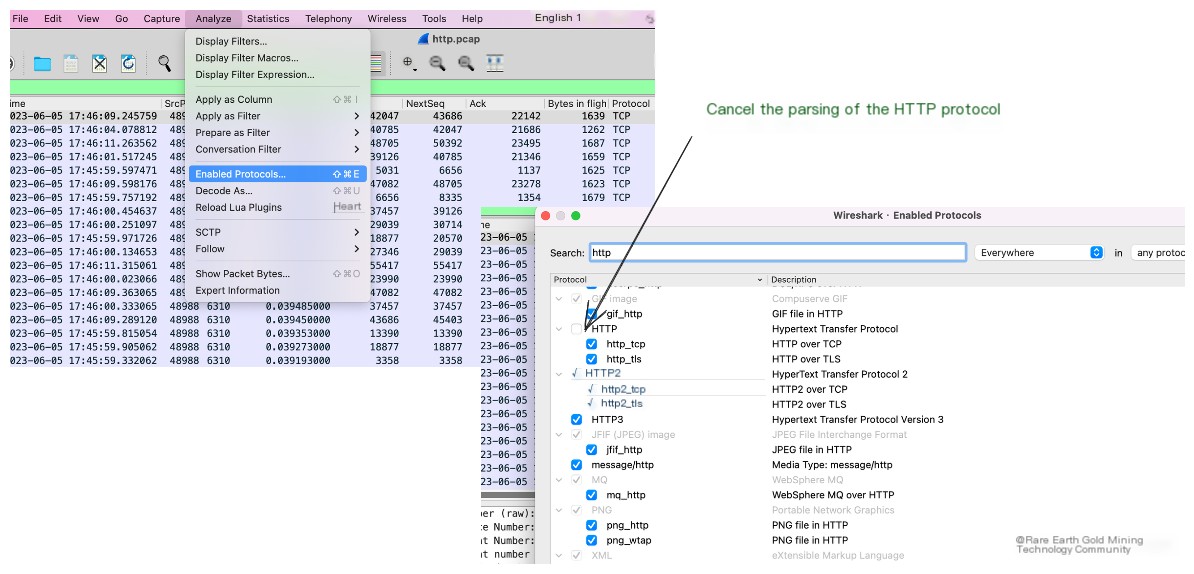
Since Wireshark by default parses the HTTP protocol, it is inconvenient for us to view TCP packets exclusively at the transport layer. Therefore, first turn off HTTP protocol parsing.
Next, set Time since previous frame as a custom column and sort it.
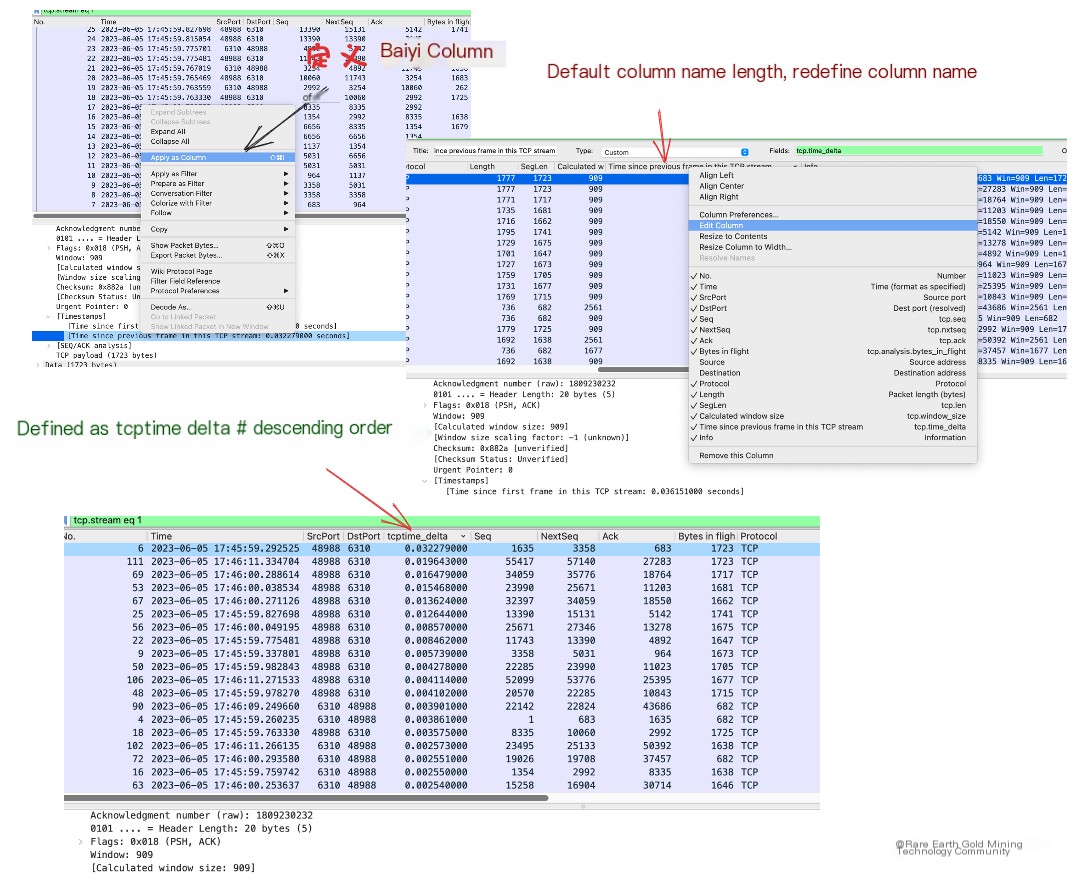
This way, you can identify which TCP packet has excessively high latency, allowing for specific analysis.
HTTP Time
Apart from analyzing TCP delays at the transport layer, you can also perform latency analysis at the application layer. Using http.time, you can obtain information about slow HTTP requests.
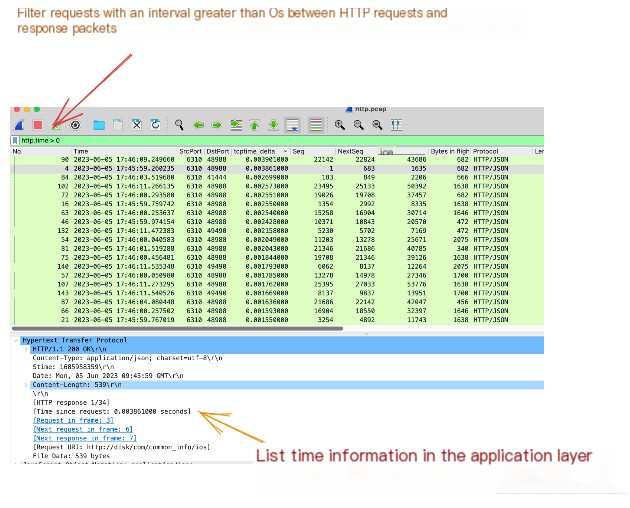
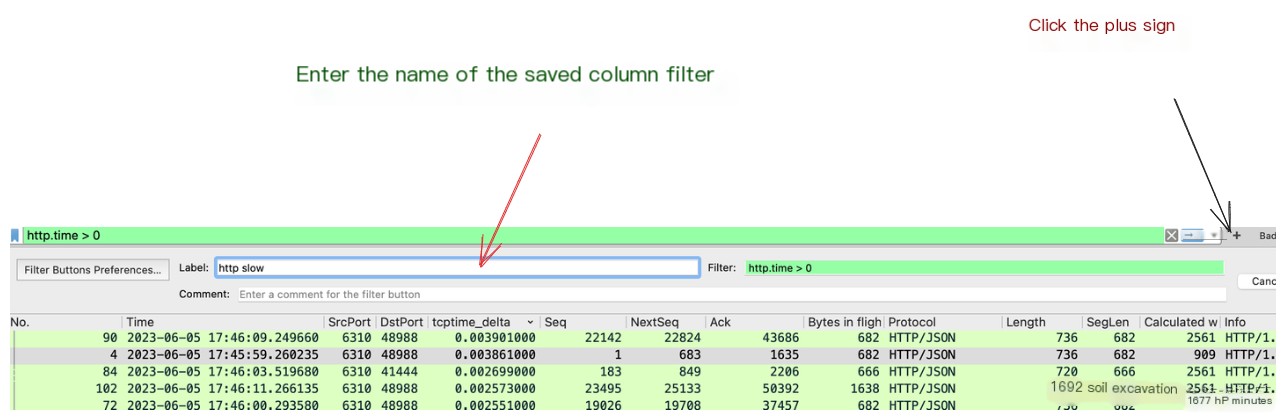
This way, you can immediately locate slow HTTP requests in the capture file. You can even save this filter to directly apply it when capturing different packets next time. Do so as shown below:
Bad TCP
Whether it’s HTTP time or TCP delta time, they are powerful tools for discovering delays. But to understand why delays occur, you must analyze the behavior of TCP.
In Wireshark, abnormal packets can be filtered using the tcp.analysis.flags filter.
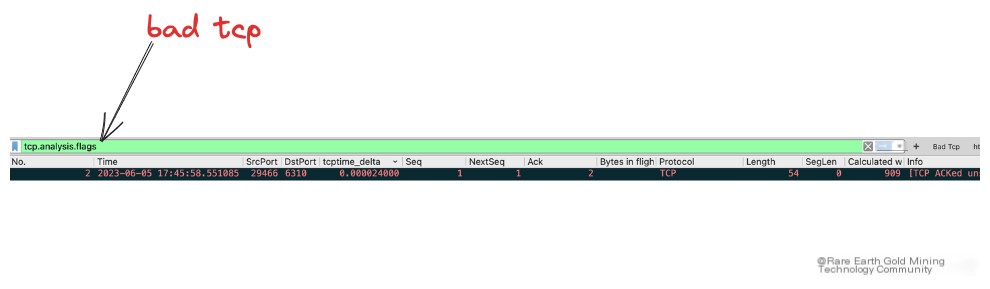
This can filter out abnormal TCP packets, such as retransmissions and duplicated Acks. Once abnormal packets are identified, you can quickly analyze the cause based on the context of these packets.
Summary
🔥🔥The knowledge about performance optimization and service monitoring is often extensive and fragmented. I will continually produce content in this area to compile this knowledge into a collection, hoping to spare us from being clueless in future performance troubleshooting.