During RTP streaming, issues such as video stuttering and screen artifacts often occur. How can these RTP streaming issues be identified? The following tool can help analyze similar problems:
https://github.com/sigusr1/rtp_parse_from_pcap
1. Implementation Approach
From a transmission perspective, common causes for stuttering and screen artifacts are as follows:
- The frames received by the receiver are incomplete (either due to the sender sending incomplete frames or packet loss during transmission).
- The interval between frame transmissions is too long, exceeding the buffer time at the receiving end.Note: There are, of course, other causes, such as compatibility issues with the bitstream or errors in the processing flow of the encoding/decoding end (e.g., we previously encountered an issue where improper handling of SEI at the decoding end caused screen artifacts). However, these issues are usually persistent and occur throughout the entire video playback process. Transmission-induced issues, on the other hand, are quite random.
The quickest way to diagnose these types of issues is using Wireshark or tcpdump to capture packets, then analyze them. This helps determine if the problem lies with the sender or receiver, narrowing down the investigation scope. Since I primarily work with RTP over RTSP (TCP transmission method), the following discussion and tool development focus on this scenario.
The general approach is to replay the captured file, parse the packets during replay, and analyze RTP information and frame intervals. The following issues must be considered during processing:
- How to handle TCP reordering and retransmissions?
- What if the capture tool misses packets? (a common occurrence when dealing with large volumes of data)
- How to handle packets captured in preview mode? These packets lack RTSP interaction and TCP handshake, meaning session tracking is needed.
- Each packet’s timestamp must be retained to analyze the delay during transmission.
Based on the above approach, the following data processing flow can be implemented:
 >
>
- libpcap enables replay of captured files, extracting packets one by one and preserving their timestamp information. This solves Issue 4.
- libpcap’s output is directly fed into libnids for TCP stream analysis, addressing Issues 1, 2, and 3.
- libnids’ output gives the raw TCP byte stream, allowing for direct RTP parsing.
2. Usage Method
- Enter the rtp_parser/bin directory.
- Execute
./rtp_parser rtsp.pcapwherertsp.pcapis the capture file name. - Upon command completion, a parsing file will be generated in the current directory with a name like
src[192.168.43.252[554]]--dst[192.168.43.1[39535]].txt. Each stream in the capture file will generate a separate parsing file. - The file content includes information such as Frm_Interval, representing the interval between adjacent frames. Its value is calculated as:
current frame’s end time minus previous frame’s end time. In the example, the Frm_Interval calculation process is1514774319.466358s - 1514774318.891198s = 575160us.
 >
>
- The
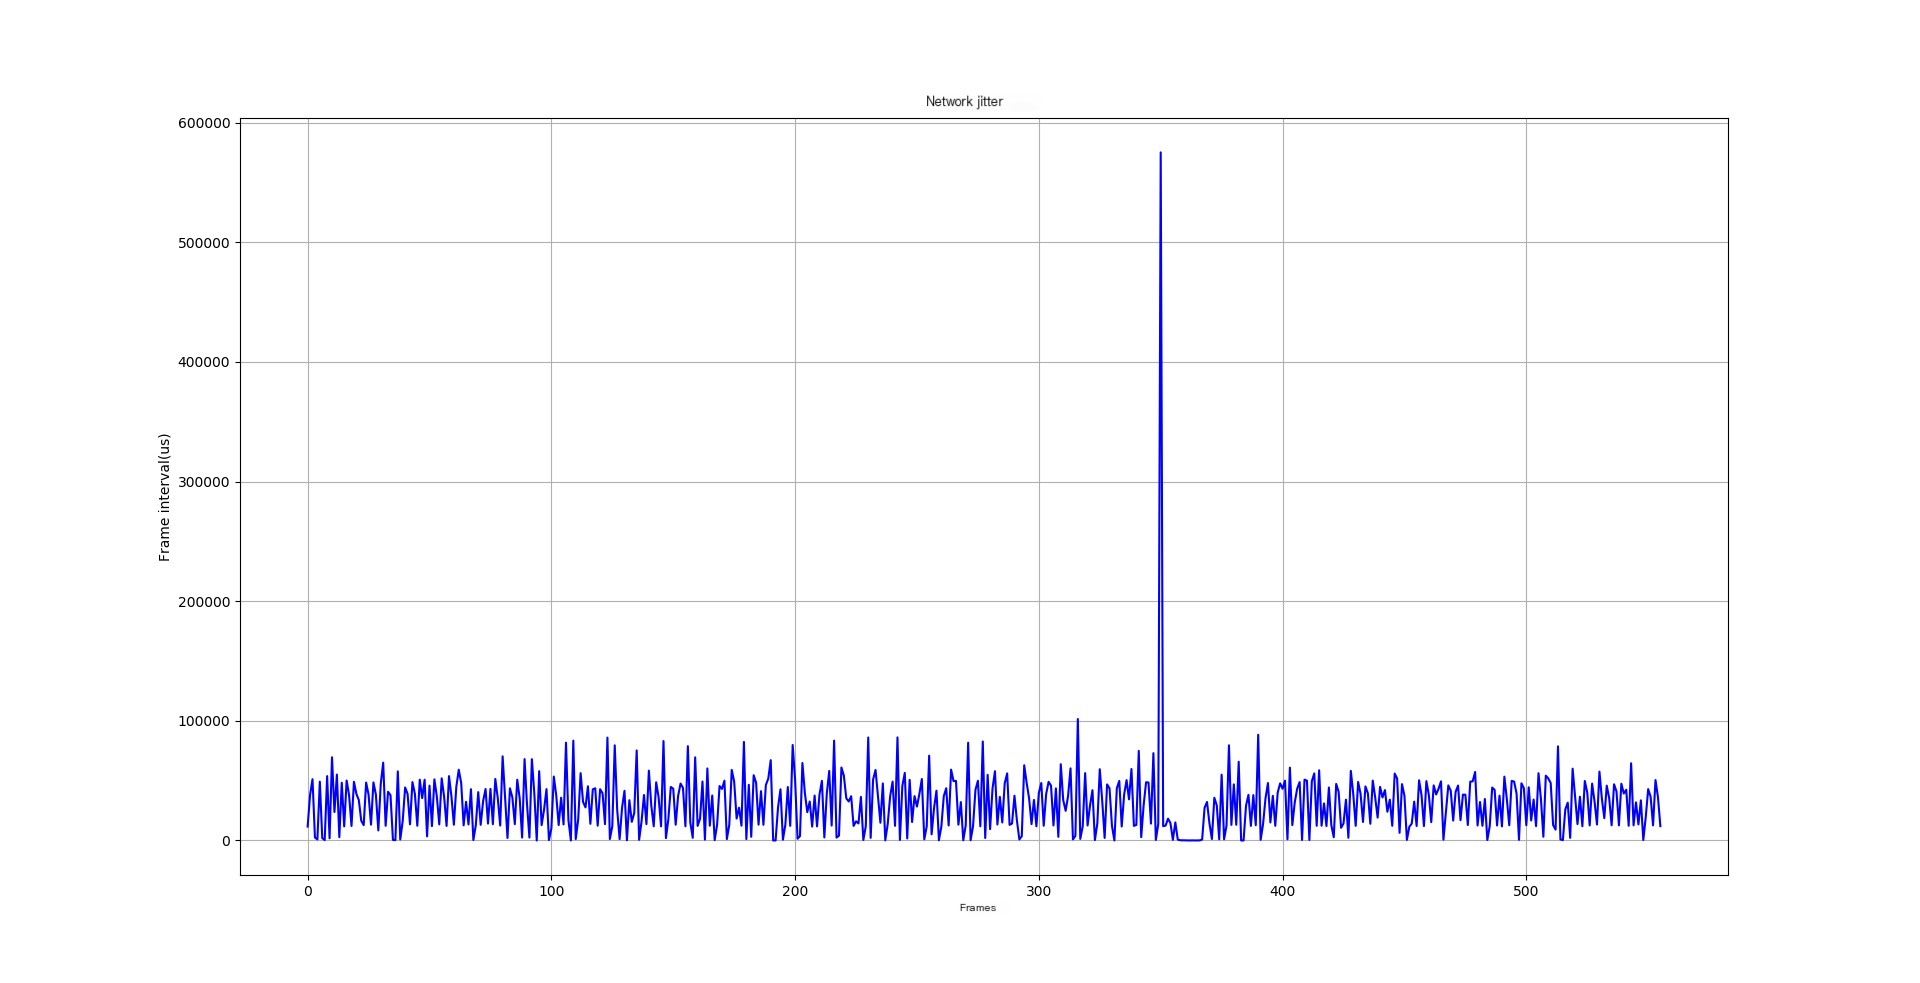
analyse.pyscript in the rtp_parser/bin directory can analyze the parsed txt files:a. It displays jitter during transmission in graphical form.b. If frame intervals are too large (exceeding 100ms), a command line prompt will appear.c. If RTP sequence numbers are discontinuous, a command line prompt will appear.Executepython analyse.py src[192.168.43.252[554]]--dst[192.168.43.1[39535]].txtto get analysis results as shown in the image below. The x-axis represents frames, and the y-axis represents frame intervals in microseconds. As shown, a frame interval reached over 500 ms, likely causing stuttering.

The command line will also output prompts if frame intervals are too large. The last line corresponds to the peak in the graph:

From the parsed txt file, it is evident that the issue occurs between RTP sequence numbers 18492 and 18500. Analyzing the capture file shows a 500 ms interval between RTP sequence numbers 18492 and 18493 (18492 and 18491 are in the same TCP packet, and Wireshark does not display 18492), while the receiver’s window remains fine, indicating the sender caused this interval. Further inspection of the sender’s code indeed reveals a branch where a 500 ms sleep occurs under certain conditions.

3. Compilation Method
This tool depends on the open-source libraries libpcap (source version 1.8.1, without modifications) and libnids (source modified based on version 1.24). Typically, steps 1 and 2 are not needed unless special requirements arise.
- Enter the libpcap directory, compile to generate the static library libpcap.a, and copy it to the rtp_parser/lib directory:a. Run
./configure. If dependencies are missing, follow the prompts to install the corresponding dependency components.b. Runmaketo generate libpcap.a.c. Copy libpcap.a to the rtp_parser/lib directory. - Enter the libnids folder, and compile libnids. This library has been modified accordingly; git logs can show the changes made:a. Run the following command to generate a makefile:
./configure --with-libpcap=../libpcap --enable-tcpreasm --disable-libglib --disable-libnet. The –enable-tcpreasm option allows tracking incomplete tcp connections. Enabling this option ensures tracking of the tcp data stream even if the capture file lacks the three-way handshake process.b. Runmaketo generate libnids.a.c. Copy libnids.a to the rtp_parser/lib directory. - Enter the rtp_parser folder, compile the executable rtp_parser:a. Run
maketo generate the executable rtp_parser in the bin directory.b. Execute./rtp_parser rtsp.pcap(wherertsp.pcapis the capture file) in the bin directory to generate parsing files.
The current implementation of rtp_parser is relatively simple. It can be modified as needed, followed by compilation in step 3.


