

Background
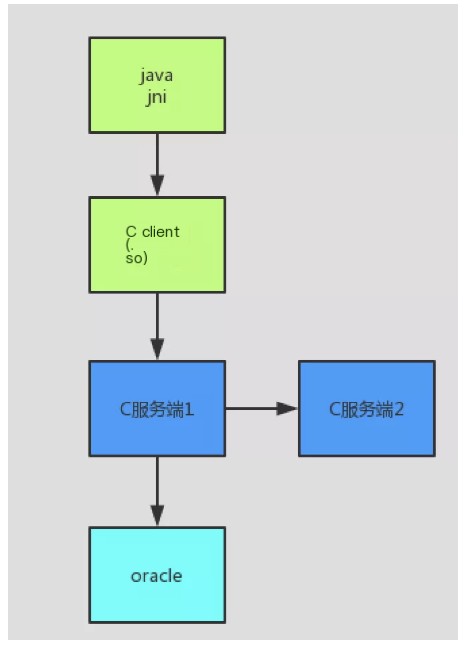
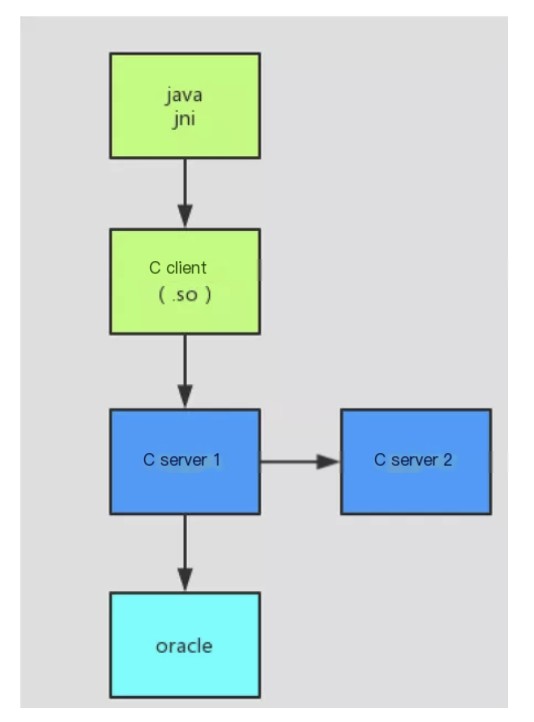
The company recently launched a new system, the main architecture is as follows:
 />
/>
After deploying the test environment system, two problems arose:
1. Loadrunner performance testing TPS doesn’t increase. Testing the Java interface, TPS on a single machine only reached a little over 100 TPS and did not go up, the time taken increased from 100ms per access to about 1s at 110 concurrency. 2. During testing, C server 1 would often crash unexpectedly.
For certain reasons, the C-related programs of this project did not have source code, only installation deployment files. To solve the above two problems, several colleagues and I, together with colleagues in Chongqing, participated in troubleshooting and solving the problems. Because there was no source code, there were many difficulties in between. After a month’s effort, we finally resolved the above two issues. We learned a lot during the entire troubleshooting process.
Analysis Tools Used
1. tcpdump,
2. wireshark,
3. gdb,
4. 010 editor,
5. Flame Graph,
6. ida,
7. SQL statement time tracking from the database,
8. Oracle ASH report,
9. loadrunner
Summary
1. There is a performance bottleneck in long socket connections calling C server from the C client. Using tcpdump and wireshark for binary analysis to identify the transmission protocol and replace this with Java calling the C server, the single machine TPS doubled, and performance tripled.
2. There is an issue with the database statements containing ‘for update’, which affected concurrency. Through analysis, we replaced ‘for update’ with a sequence from a business standpoint, and used 010 editor to directly modify binary files, changing the logic associated with ‘for update’ to use sequences. The system now has the ability to expand server TPS in line with capacity increases.
3. There is a bottleneck with database insert statements under concurrency, which was solved by increasing the Oracle redo log size, further boosting TPS by 40%.
4. Programs randomly crash through analysis of the core dump file with gdb, locating the issue to the use of ‘gethostbyname’ under concurrency conditions, and a temporary fix was adopted.
Analysis Process
1. First Bottleneck Location
Initially investigating the problem, loadrunner tested the Java interface as concurrent users increased from 0 to 110, where TPS rose to about 100 and stopped improving, with response times increasing from 100ms to 1s. Our focus at this point was on identifying the primary bottleneck.
 />
/>
Looking at the architecture diagram again, all five nodes could potentially be the bottleneck. At this point, we used database DBA privileges to capture time-consuming SQL statements but couldn’t find any, so we ruled out any database problems. Logs captured steps highlighting that JNI calls consumed most of the time, initially locating the bottleneck to the C client, C server 1, and C server 2.
Without source code, we used tcpdump packet capture analysis on C server 1
Code language: javascriptCopy
tcpdump -i eth0 -s 0 -w aa.txt host java client's IPThe packet was analyzed using wireshark
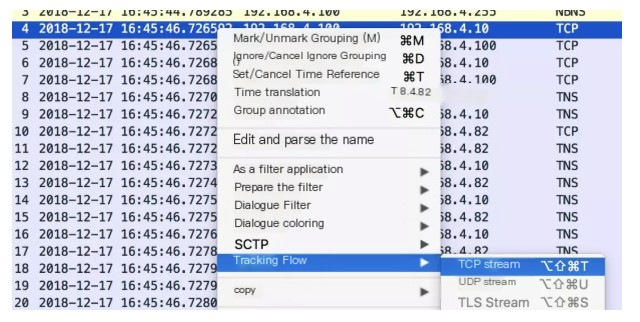
By tracking streams – TCP stream analysis, server times hadn’t changed significantly. Since the C client and C server used long connections, it was possible multiple requests might share a connection. Consequently, the analyzed data might have been inaccurate. Therefore, we used loadrunner testing keeping other conditions unchanged, examining time changes with one C server 1 and two C server 1s respectively, and similarly with Java servers.
The issue was eventually pinpointed to the C client. (PS: During the wireshark data analysis, we also figured out TCP delayed acknowledgment with a master, Qin Di.)
2. Modifying the C Client
The C client and C server communicate over long connections, making direct modification of C code challenging, so we decided to replace C with Java. This required analyzing the protocol used for communication between Cs and rewriting it in Java according to the protocol. We proposed a coding protocol from prior experience and confirmed it through wireshark binary analysis.
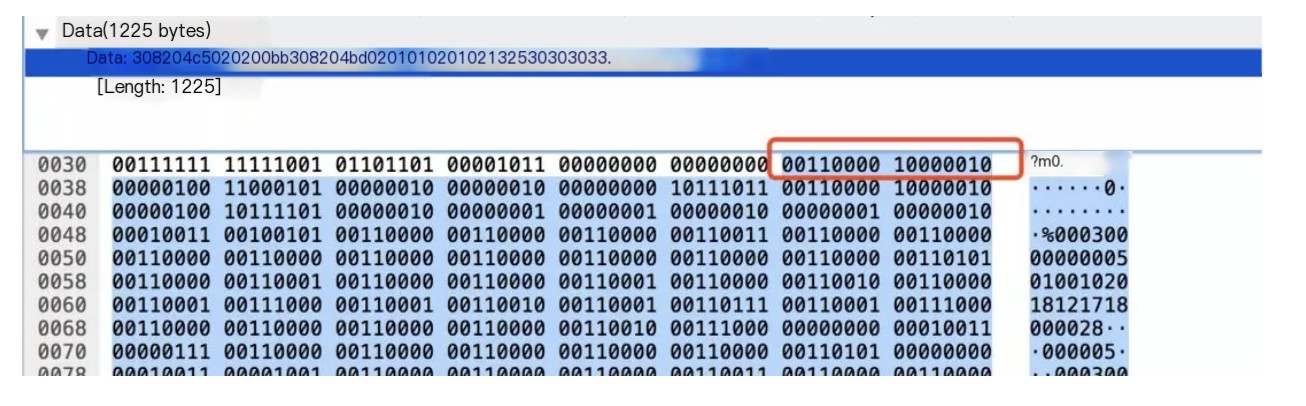
After rewriting it in Java based on this protocol, under the same condition of 110 concurrent users, TPS increased to 210 (doubled) and the time was reduced to 330ms (one-third of the original).
3. Second Bottleneck Location
After the second step optimization, TPS doubled, but when expanding Tomcat and C server, TPS remained at about 210 without increasing. We therefore continued locating the new bottleneck. At that time, we obtained a real-time Oracle time-consuming SQL query statement from the DBA.
Code language: javascriptCopy
select(select b.SQL_TEXT from v$sqlarea b where b.SQL_ID=a.SQL_ID ) sqltxt,(select c.SQL_FULLTEXT from v$sqlarea c where c.SQL_ID=a.SQL_ID ) sqlfulltxt,a.username, a.LAST_CALL_ET,a.MACHINE ,a.command, a.EVENT, a.SQL_ID ,a.SID,a.SERIAL#,'alter system kill session ''' || a.SID ||','||a.SERIAL# ||''';' as killstmentfrom v$session awhere a.STATUS = 'ACTIVE'and a.USERNAME not in ('SYS', 'SYSTEM')order bya.LAST_CALL_ET desc ,a.username,a.MACHINE ,a.command, a.EVENT, a.SQL_ID ,a.SID;We discovered that during high concurrency, the ‘for update’ SQL caused some requests’ LASTCALLET column value to reach up to 6 seconds, which meant ‘for update’ caused all requests to be executed in series, affecting concurrency capability. Analyzing the business logic, we temporarily replaced ‘for update’ with a sequence, but without source code, it wasn’t feasible to modify it. We ultimately converted the ‘for update’ using 010 editor by finding and replacing it in binary form.
After replacement, the TPS for 4 C servers reached 580, a 2.7x increase (580/210), with initial horizontal scaling capability for the system.
4. Third Bottleneck Location
After the prior modification carried out, the system’s TPS increased 2.7 times under 4 C servers, but not 4 times (210*4=840), indicating further bottlenecks. Further SQL given by the DBA indicated that insert statements were occasionally very time-consuming (around 1s), EVENT wait was an IO event, and DBA colleagues changed the redo log file size (this was the testing environment Oracle, previously unoptimized) from the default 50M to 1G, raising TPS to 640 (not quite 4 times, suggesting more bottlenecks, possibly still in the database, but unable to capture millisecond-level time-consumed SQL, no further investigation was conducted).
With these performance improvements and given the testing server configurations weren’t high, if online server performance is expected to reach 1000 TPS, it’ll basically meet current needs, therefore, no further performance optimization was conducted.
5. Program Process Randomly Crashing Problem
During testing, the C server process would randomly crash, and upon checking /var/log/messages, discovered core dump files had been generated and subsequently auto-deleted by the system. Dong Jian discovered how to enable core dump files as follows:
a, ulimit -c
Check if it is 0, if it is, it indicates that coredump files are set to 0, and needs to be modified to unlimited
Code language: javascriptCopy
ulimit -c unlimitedb, Modify /etc/abrt/abrt-action-save-package-data.conf
Code language: javascriptCopy
ProcessUnpackaged = yesAfter modification, when the process crashed again, the core dump file was generated, debugging in the core dump directory was conducted
gdb script path coredump
bt displays stack information

Execute the following command
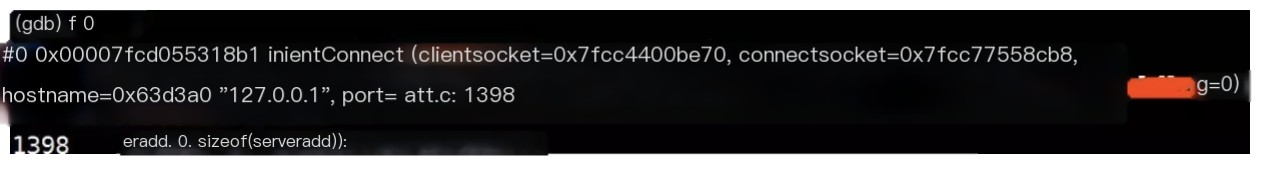
f 0
 Code language: javascriptCopy
set print pretty oninfo local //Display local variable information of the current function.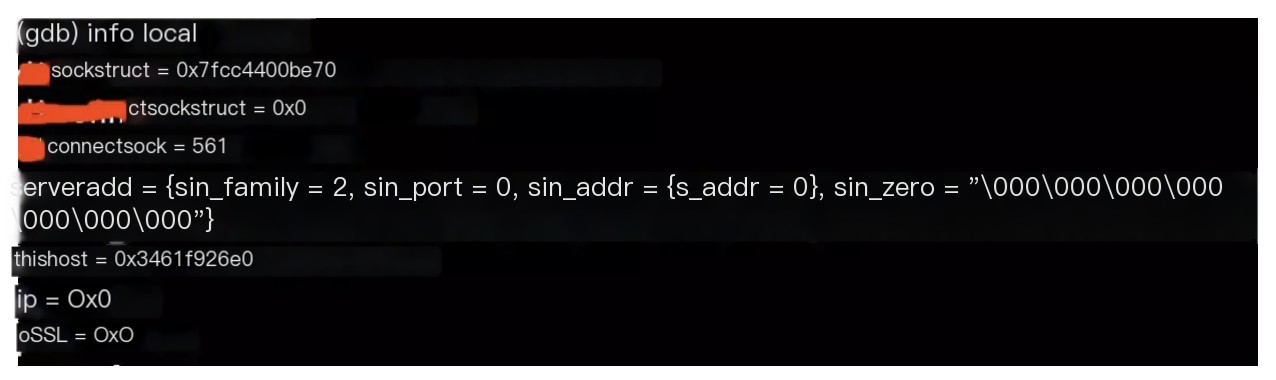
Use the p command to view within the variables

Found that the variable value of thishost->h_addr_list was null
We analyzed that it might be some methods were not thread safe during concurrent requests, causing this value to become null, thereby causing the process crash, continued debugging.
In gdb, use ‘set logging on’ to output debug information to a file

thread apply all bt outputs all thread information.
Exit gdb
Code language: javascriptCopy
grep --color -i clientconnect -C5 gdb.txtIndeed, two threads engaged in concurrent access
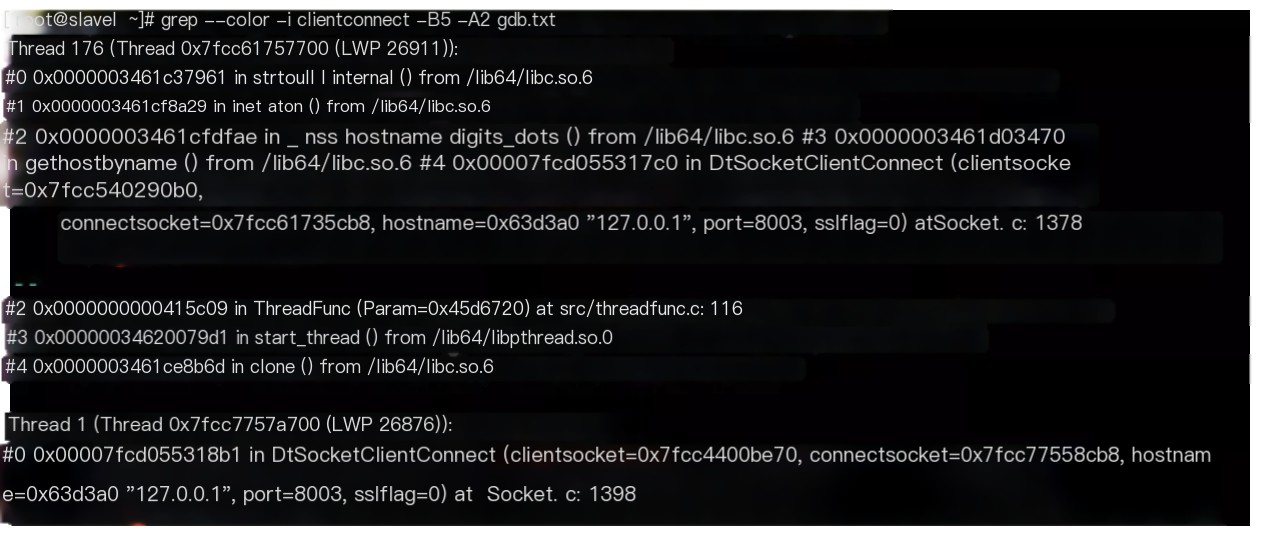
By using the IDA tool for decompiling SO, the following statement was ultimately found to have issues under concurrency, with variables in thishost potentially being initialized to null by another thread in an instant.
Code language: javascriptCopy
thishost = gethostbyname((const char *)hostname);ip = inet_ntoa(*(struct in_addr *)*thishost->h_addr_list);According to our project characteristics, as we had no remote calls, C server 1 and C server 2 were both deployed on the same server, so we temporarily adapted by hard-coding the address as 127.0.0.1, modified ‘ip = inet_ntoa(*(struct in_addr )thishost->h_addr_list);’ to a null instruction, and redeployed without the occurrence of further system crashes.