The Splunk data platform supports enterprise observability, unified security, and unlimited custom applications in hybrid environments. It is one of the most popular security solutions in the cybersecurity industry, capable of real-time collection and aggregation of host logs to enhance the efficiency of security operations.
Installing Splunk
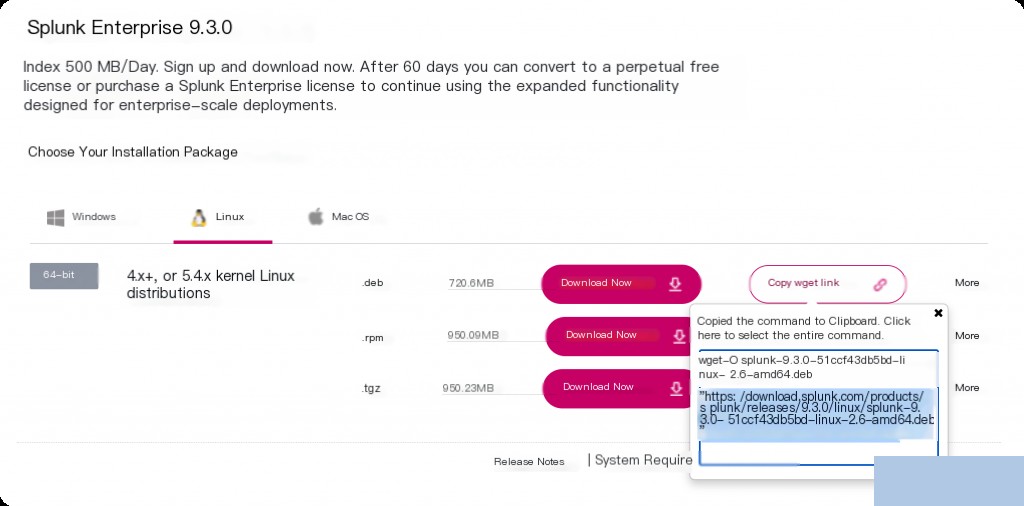
Download link: https://www.splunk.com/en_us/download/splunk-enterprise.html
You need to register an account on the Splunk official website using a corporate email to download.
dpkg -i splunk-9.3.0-51ccf43db5bd-linux-2.6-amd64.deb
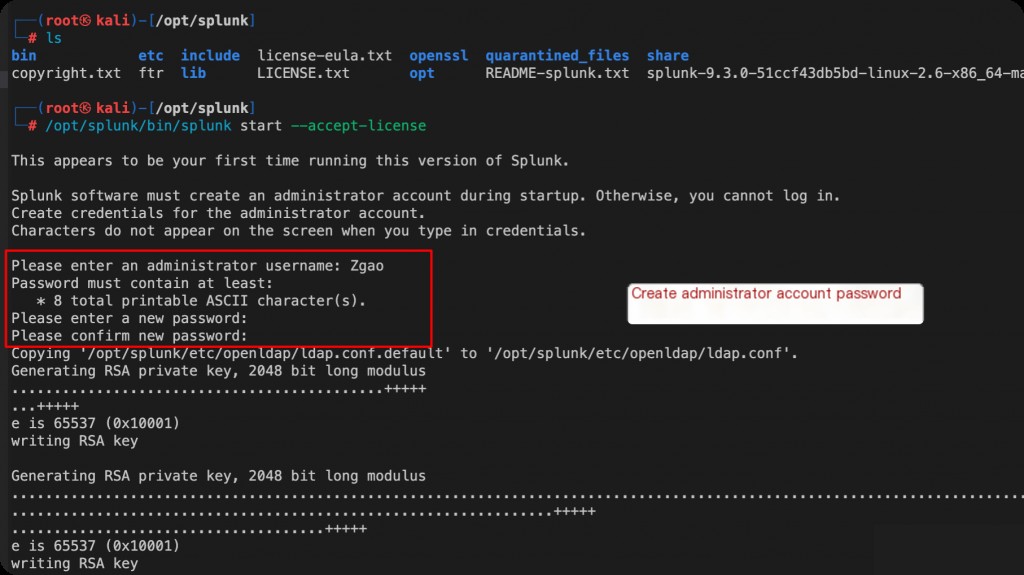
After installation, the default directory for Splunk is /opt/splunk/. Then, start Splunk.
/opt/splunk/bin/splunk start --accept-license
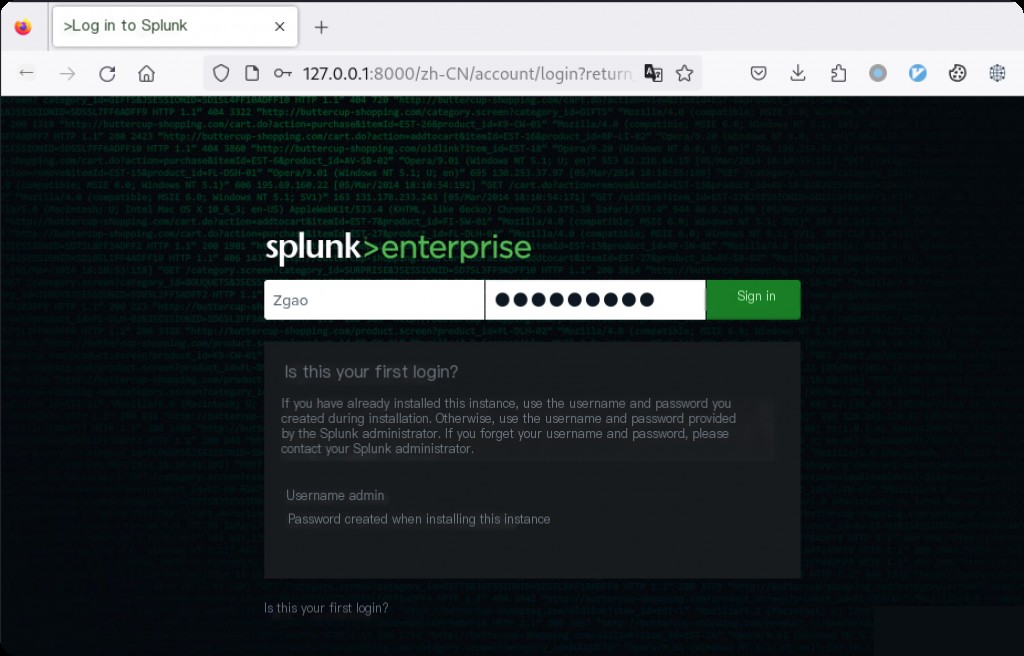
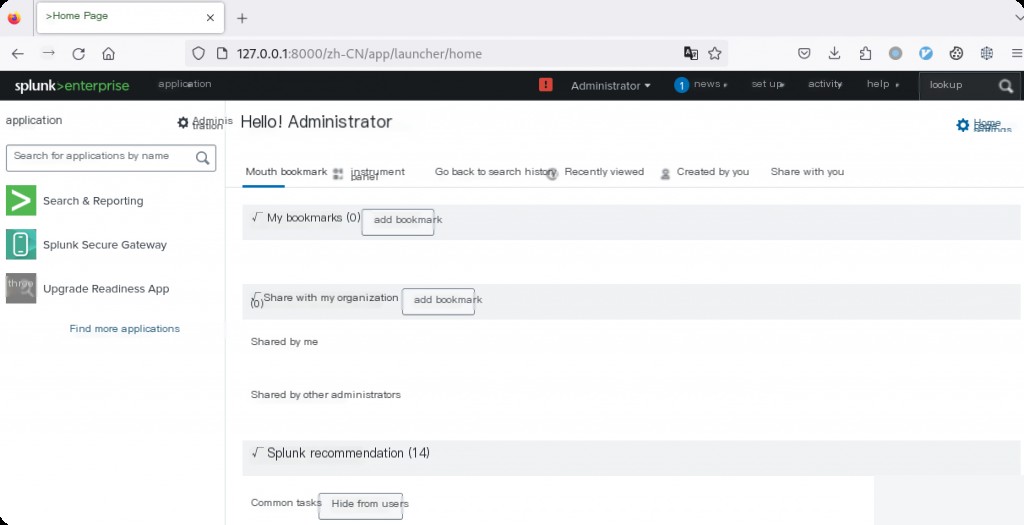
After starting, visit http://127.0.0.1:8000. If you see the login screen, the installation is complete.
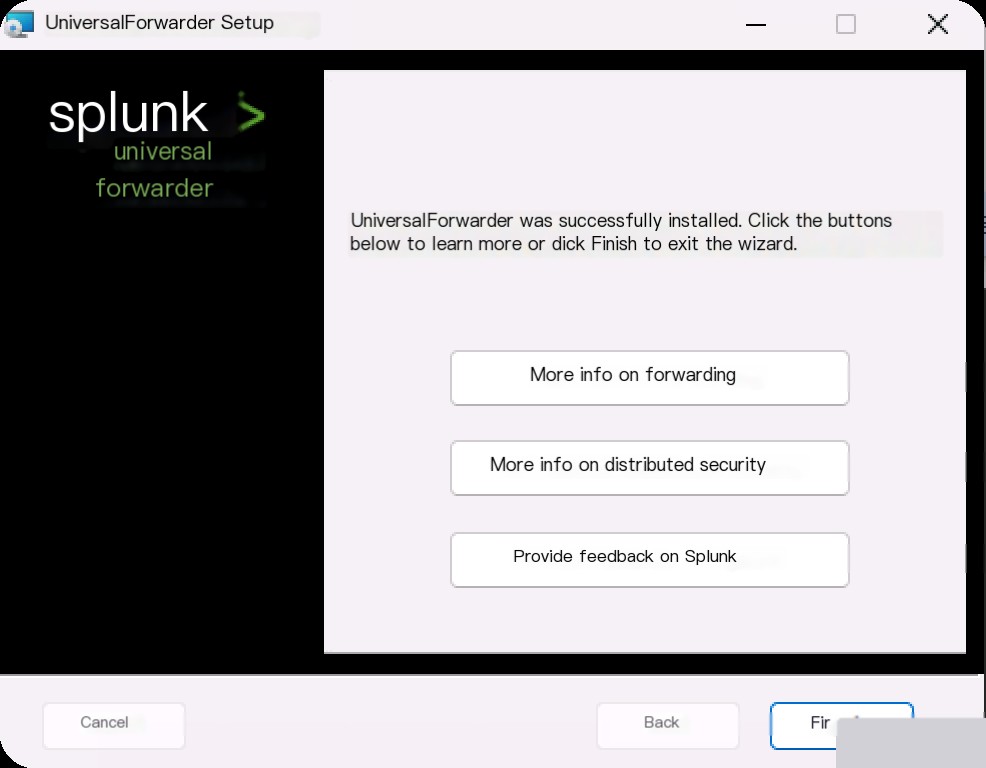
Installing the Splunk Universal Forwarder on the Client
The above steps installed the Splunk server on a Linux host, but to collect logs from Windows hosts, you need to install the Splunk Universal Forwarder on the client.

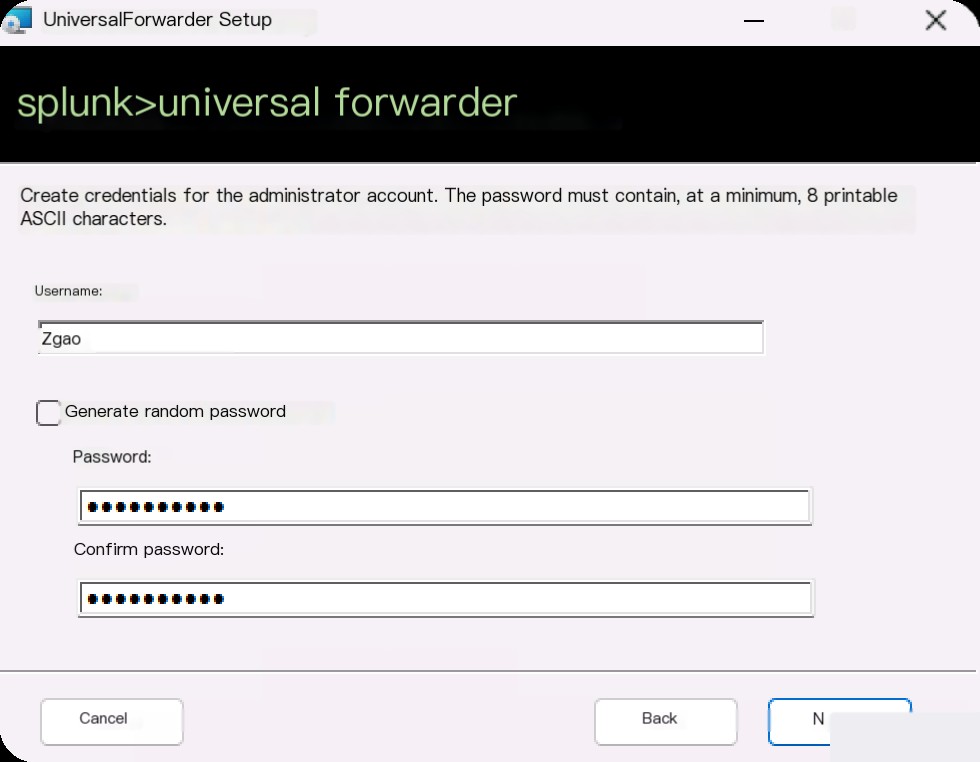
Download the Windows MSI from the official website and install it.
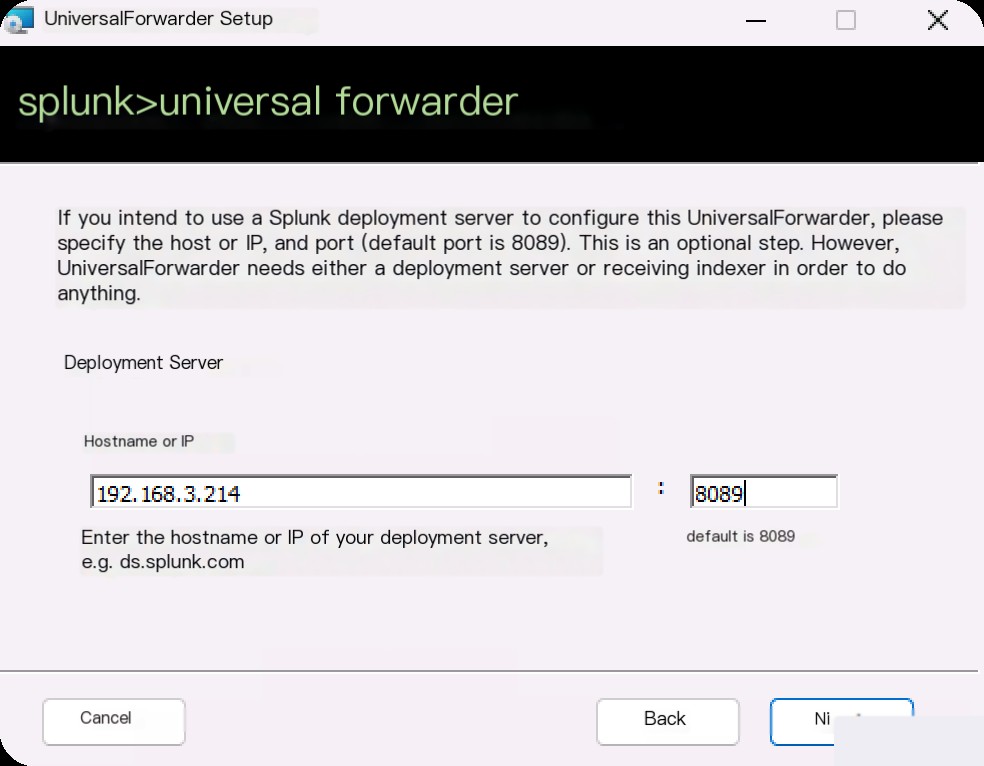
Enter the IP and port of the Splunk server to complete the installation.
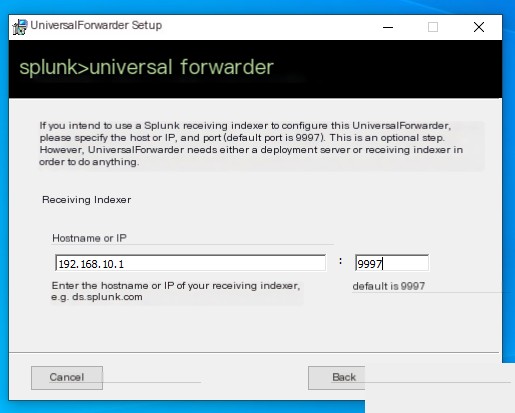
In this step, enter the port for the Splunk server to receive data. Although we have not yet opened port 9997 on Splunk, it does not affect the client configuration.
Press Win+R to open services.msc.
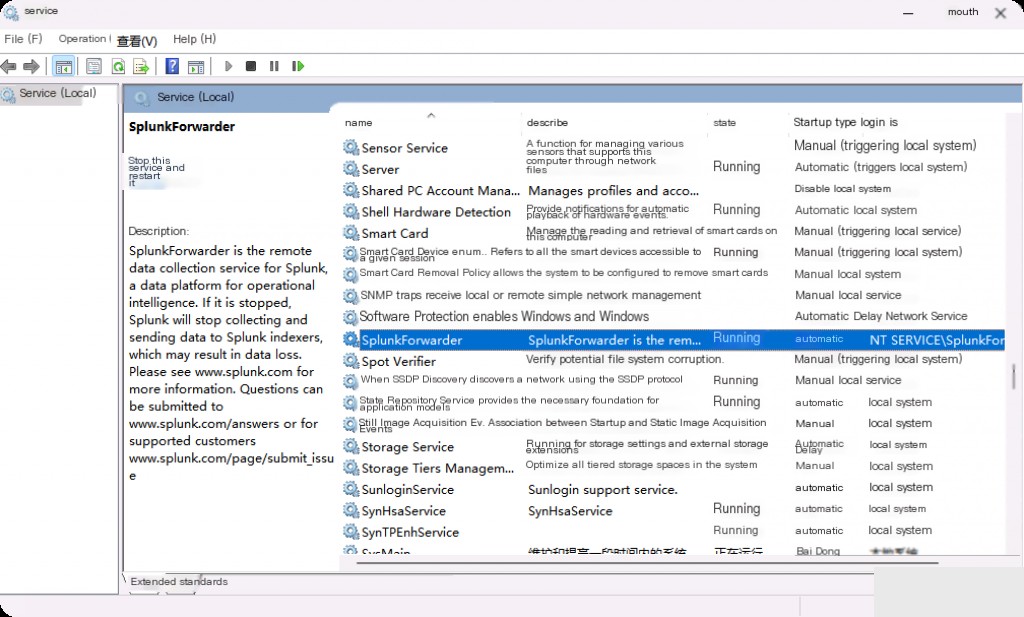
Confirm that the Splunk forwarder is running.
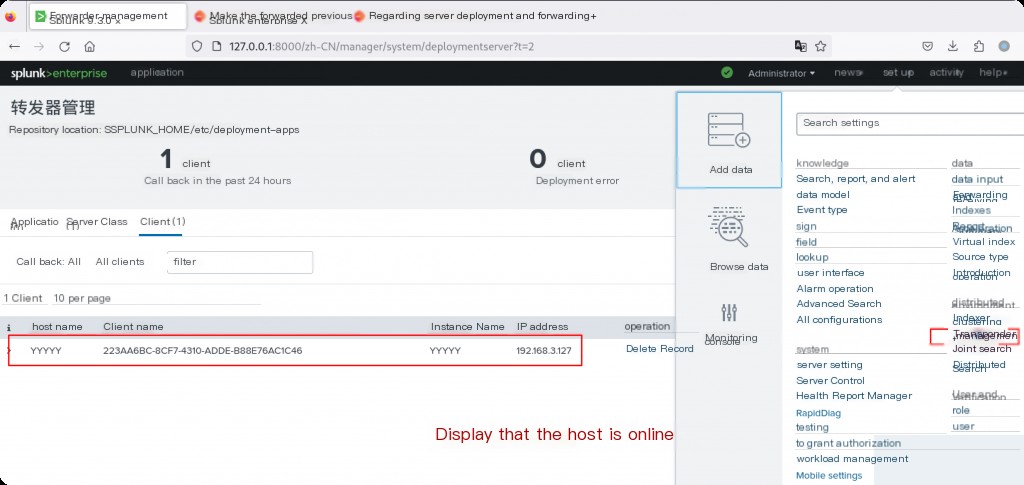
Check if the client is online on the Splunk server.
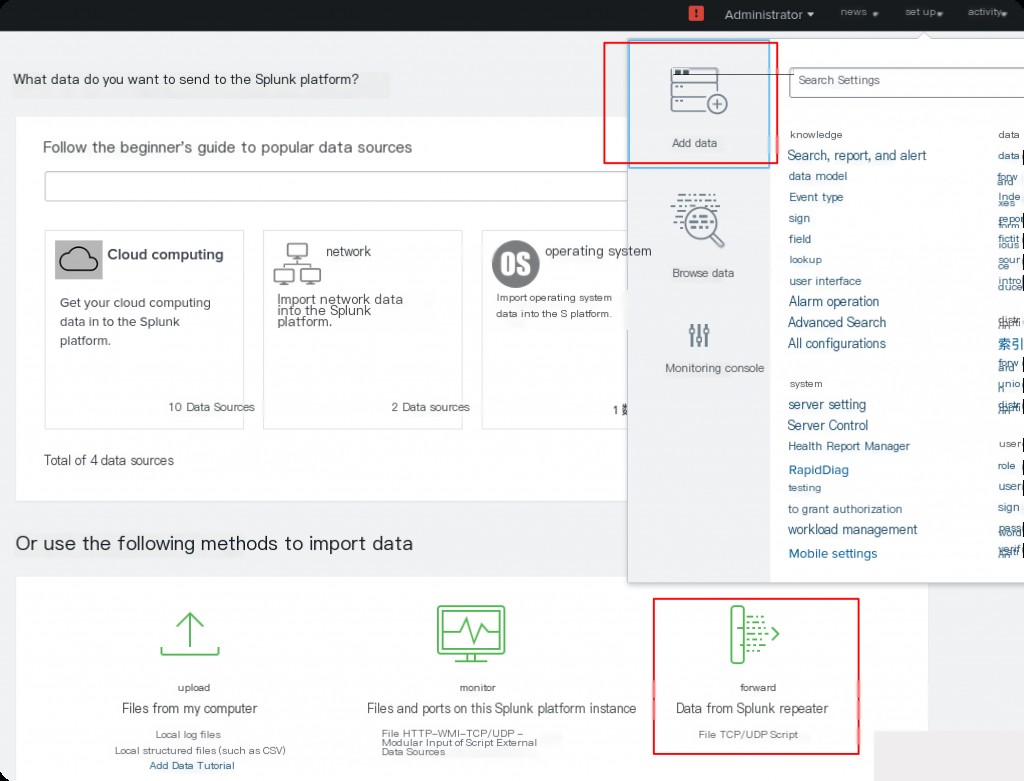
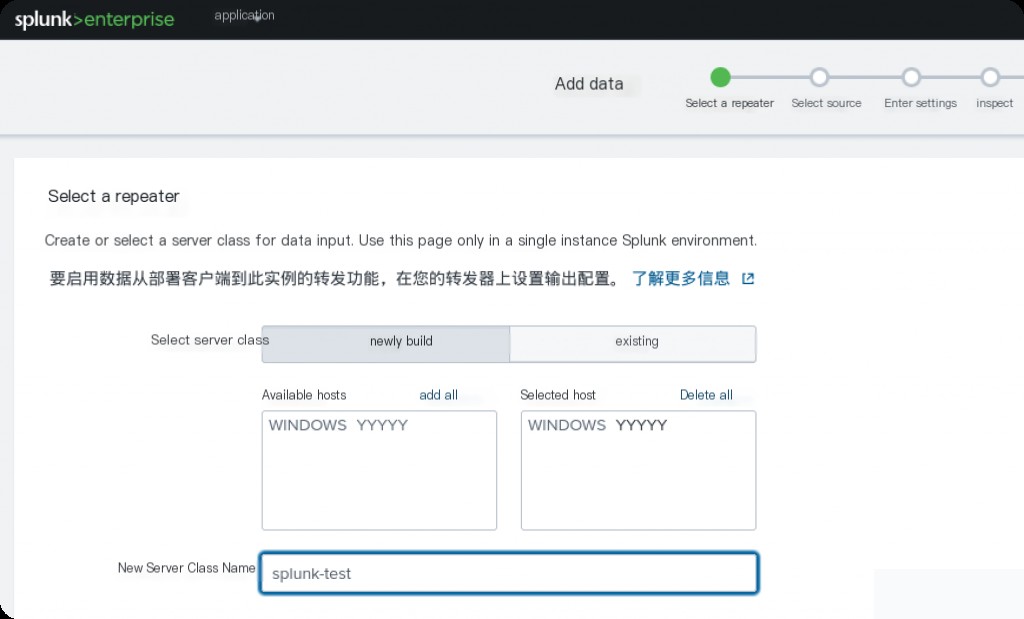
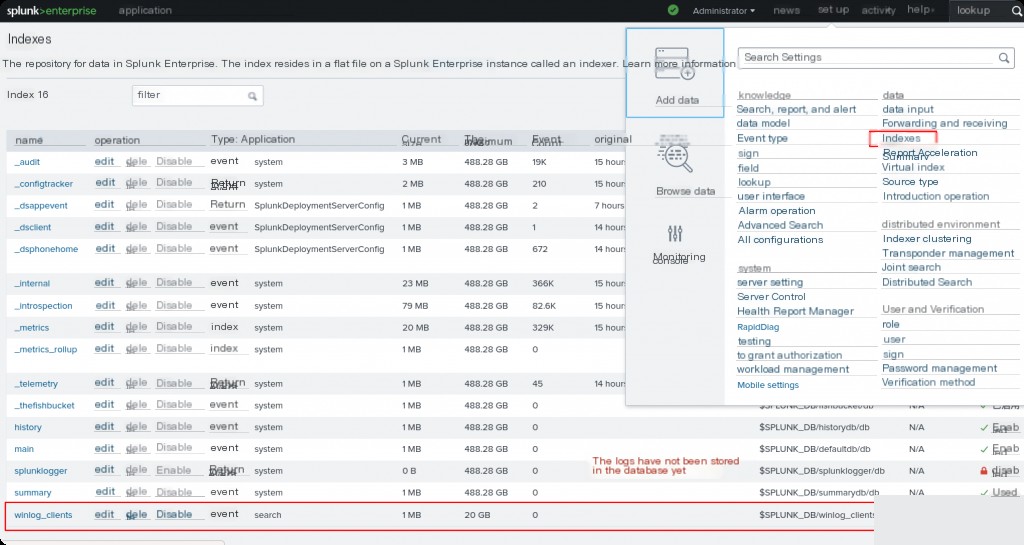
Adding Data to Splunk
Adding Data from the Forwarder
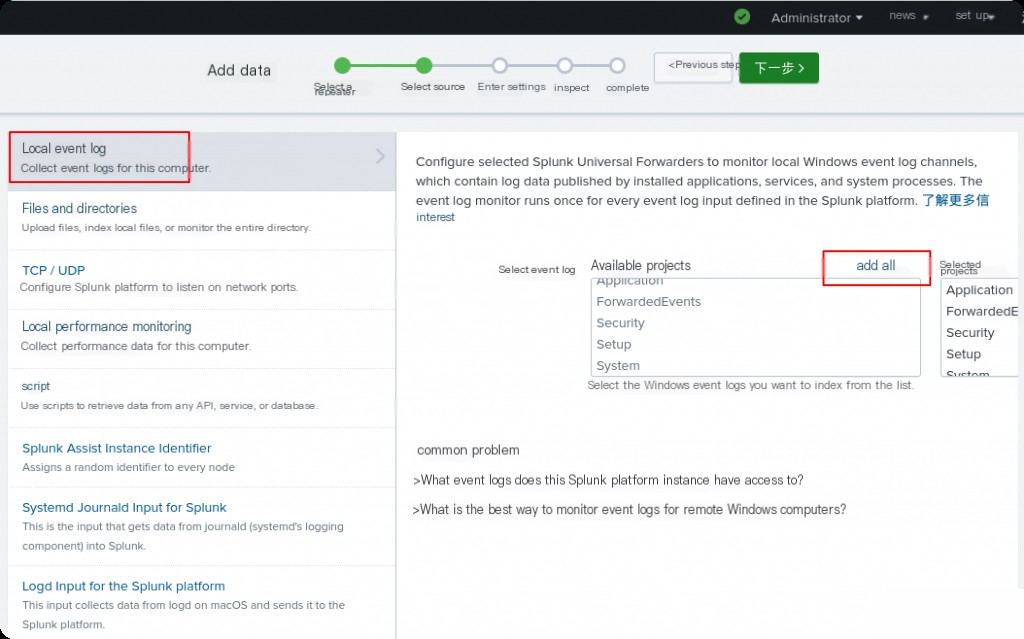
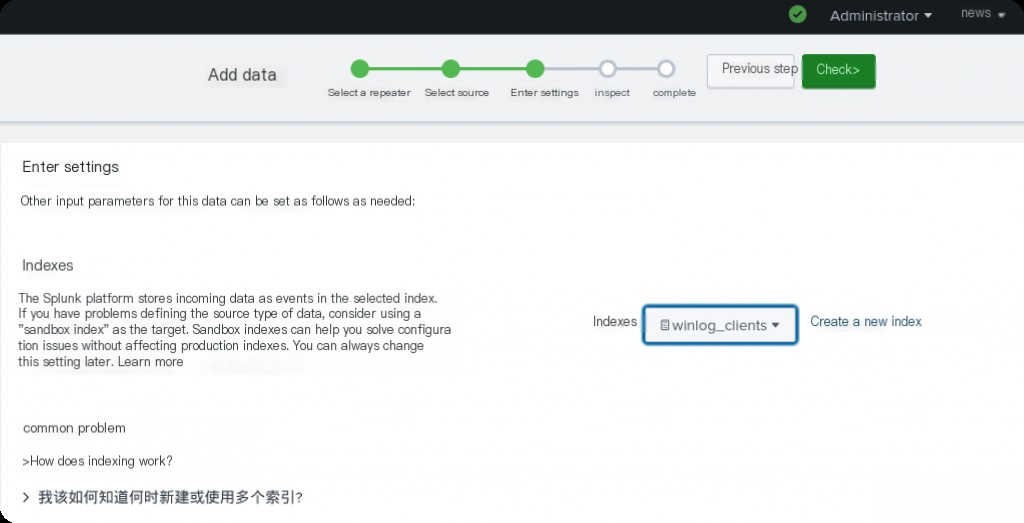
Select the index where you want to place the logs.
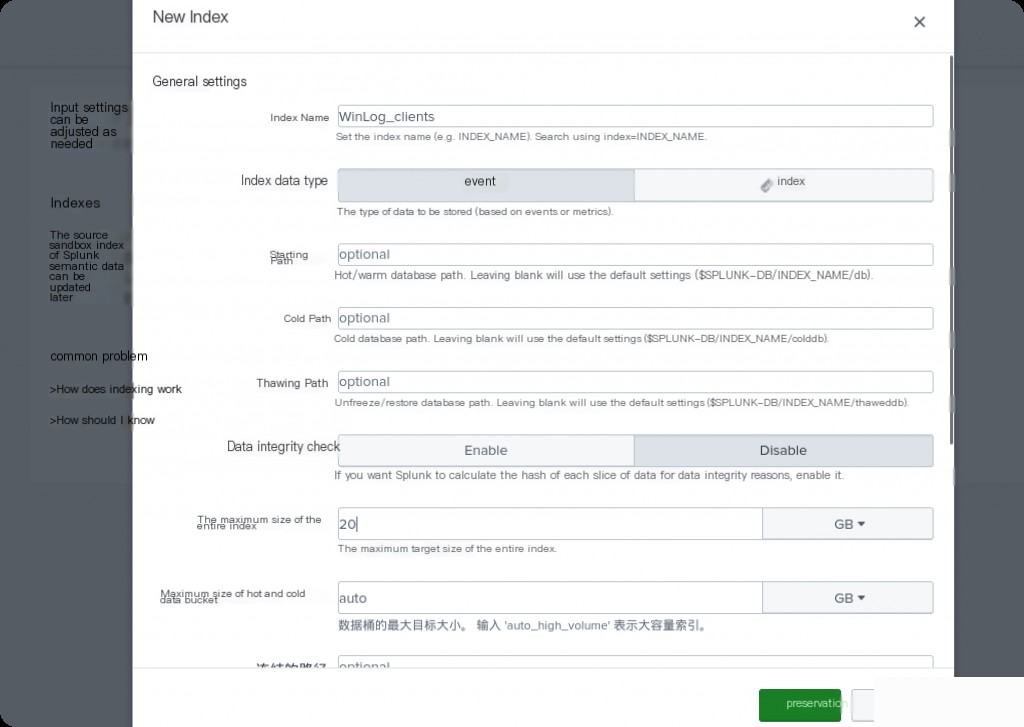
Click “Create New Index”. Here, I create a new index named “WinLog_clients”.
Click review, and if everything is correct, submit it.
Checking the Current Index
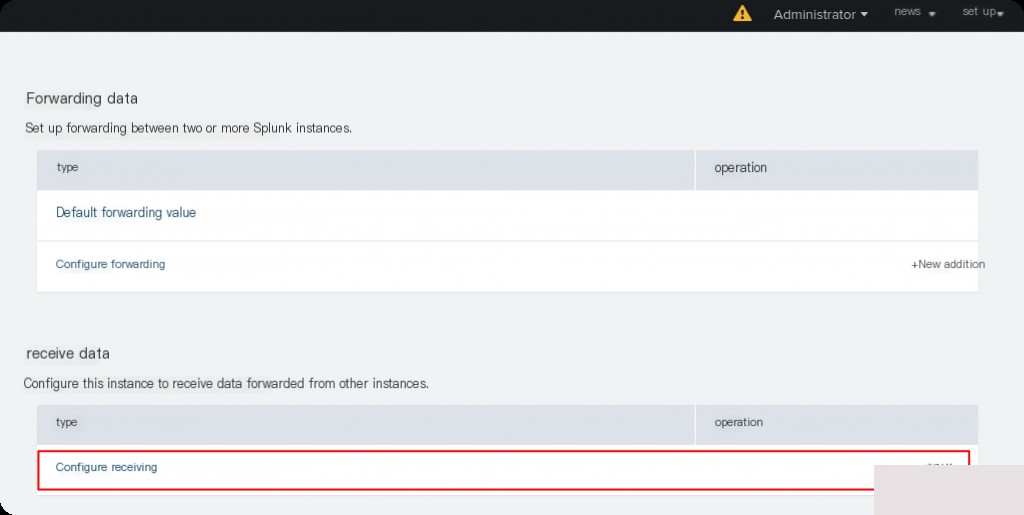
Adding a Receiver
Go to Settings > Forwarding and Receiving, and click Add New Receiving.
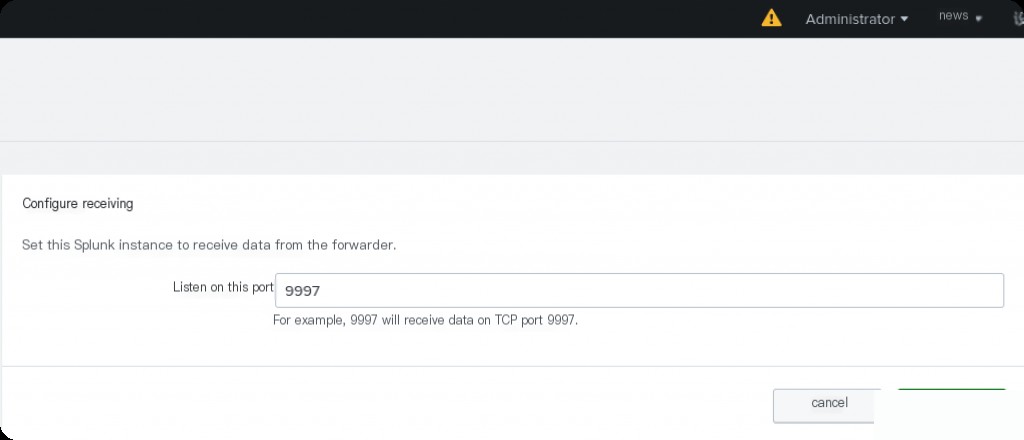
Add port 9997 (this is the default, remember it from the previous document). Wait a few minutes and check the index again to see new values.
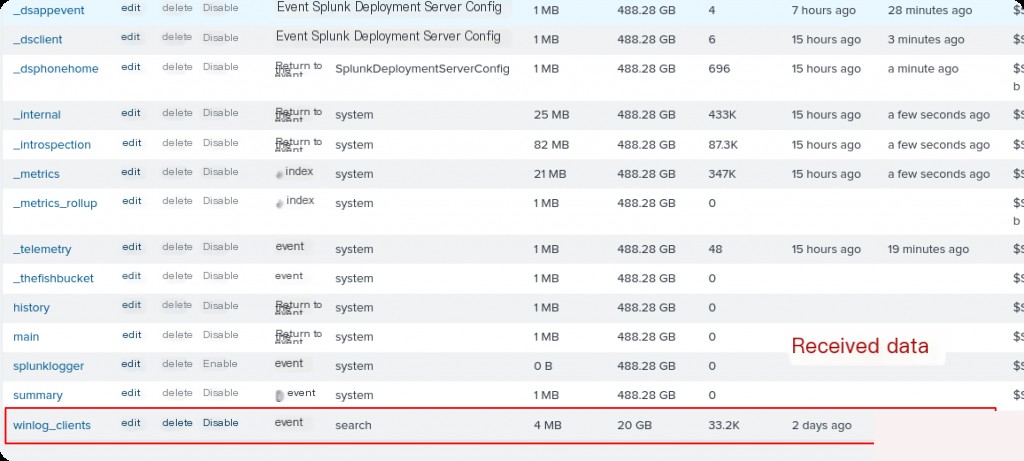
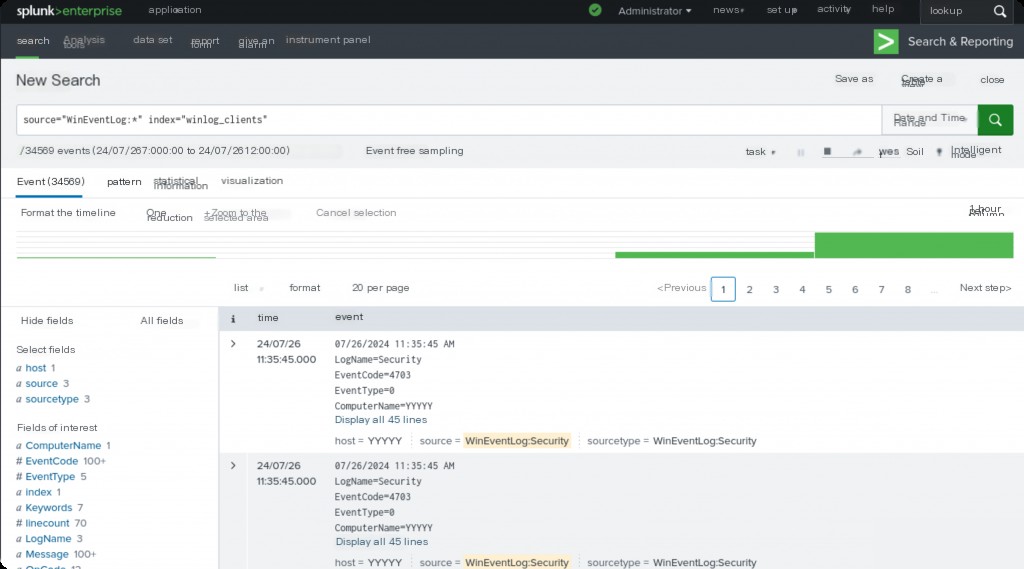
Try a quick search to see the event logs from the Windows side.
Manually Uploading Logs to Add Data
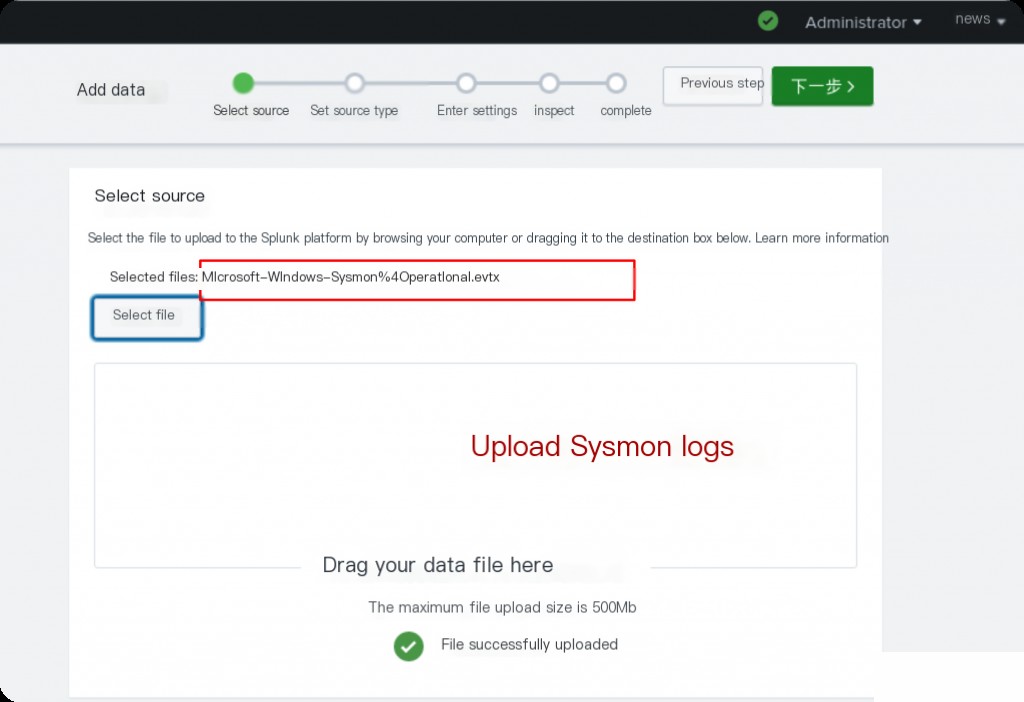
Check how Splunk reads your file. If everything is correct, click next. If needed, select a host field value and the index to use (it is recommended to keep the default values) and continue to the end to start searching.
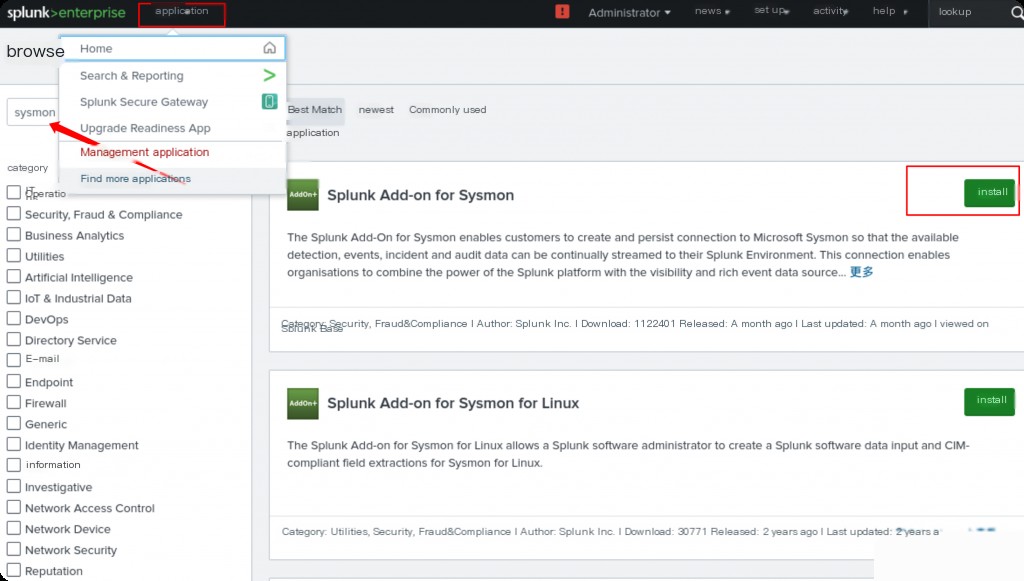
Installing Splunk Plugins
The above steps manually uploaded sysmon’s evtx logs, but Splunk cannot parse them by default. You need to manually add the sysmon parsing plugin in the Splunk app.
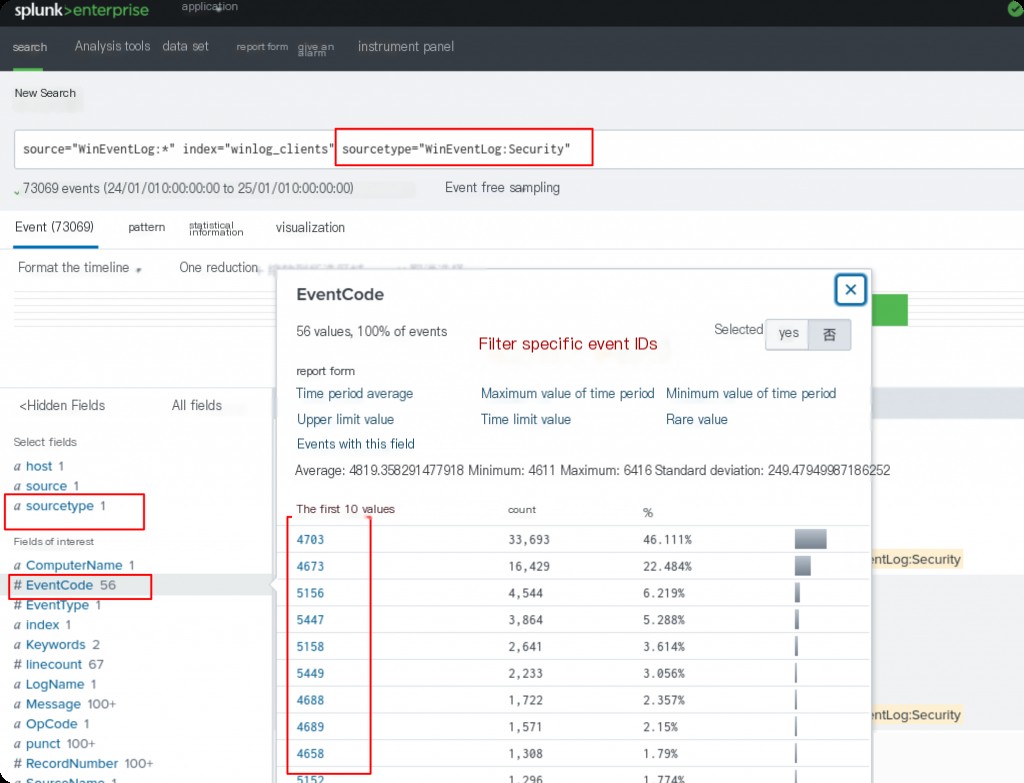
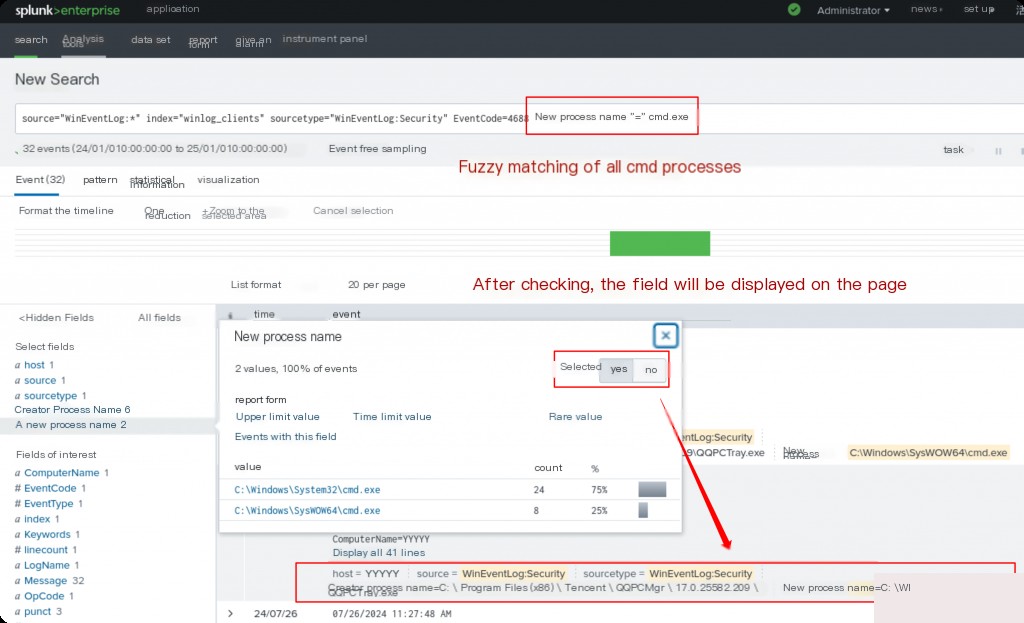
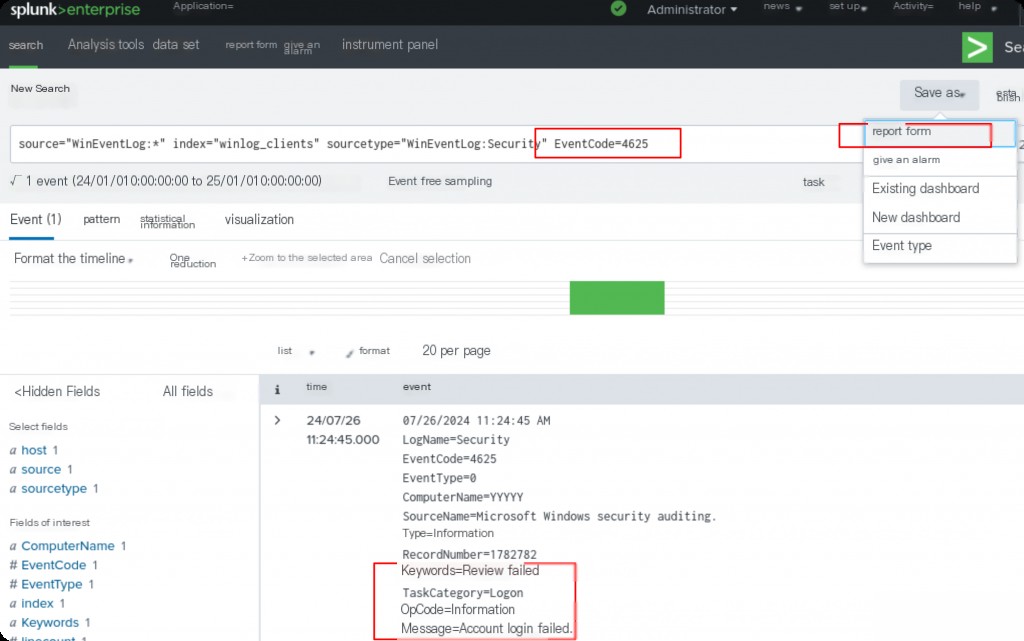
Searching in Splunk
- Field names are case-sensitive
- Field values are case-insensitive
- Wildcards can be used (use *)
- Operators like AND, OR, NOT can be used
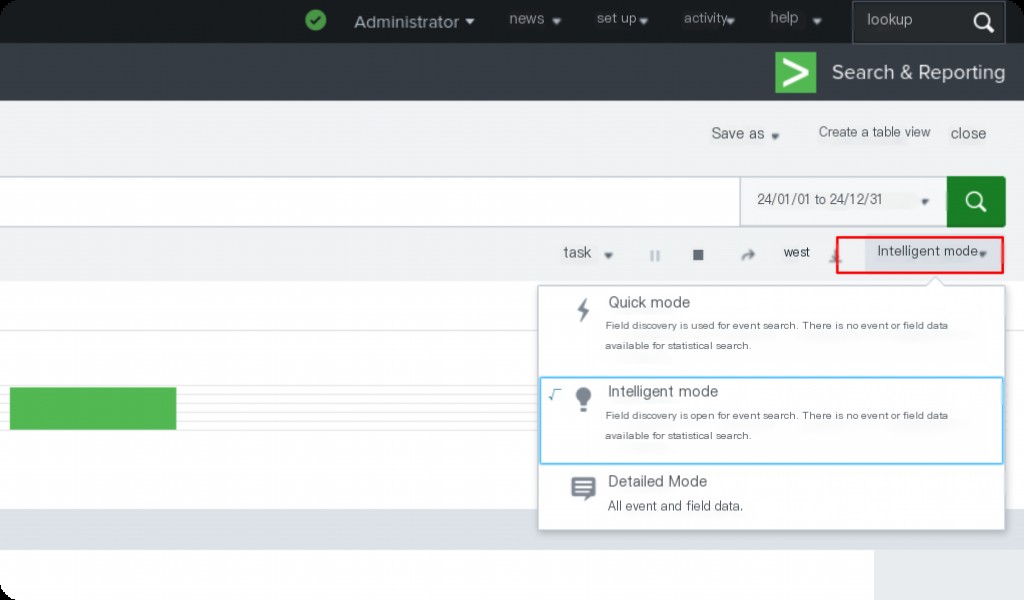
You can use wildcards (“*”) and operators in the search bar, and mix them as well.
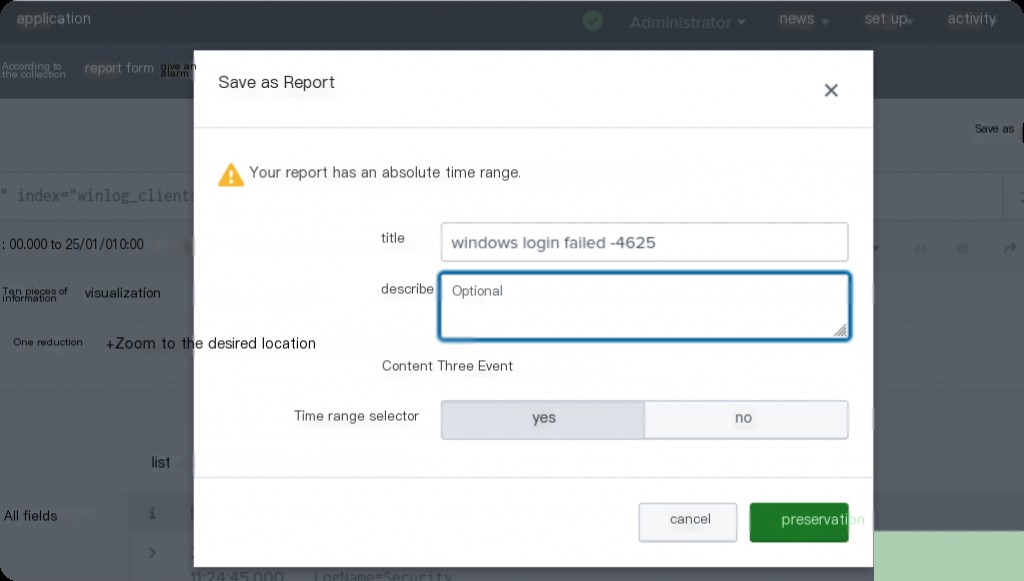
Generating Splunk Reports
Reports are saved search results. Reports can be scheduled or run as needed. For example, finding logs of failed login attempts by accounts with admin privileges.
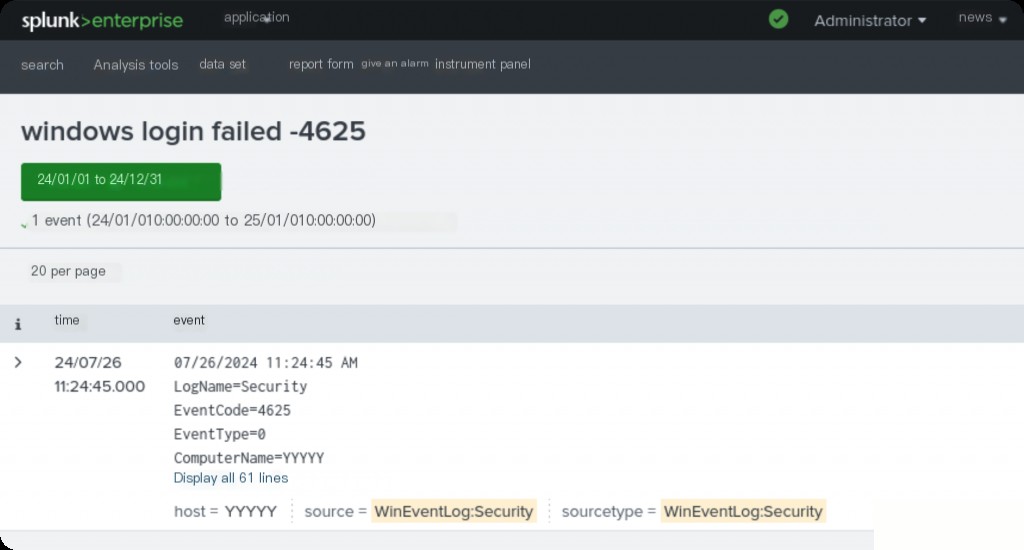
View the report we just generated, which is essentially the exported search results.
We can also configure the report to be sent every morning at 8 AM to know about the failed connections from the previous day.
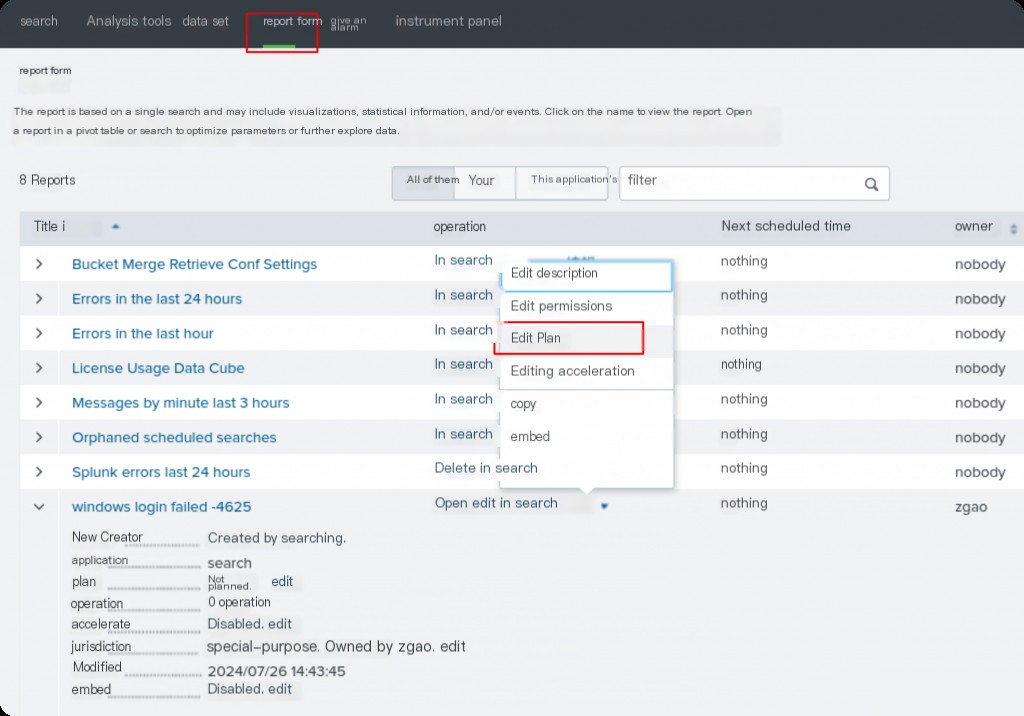
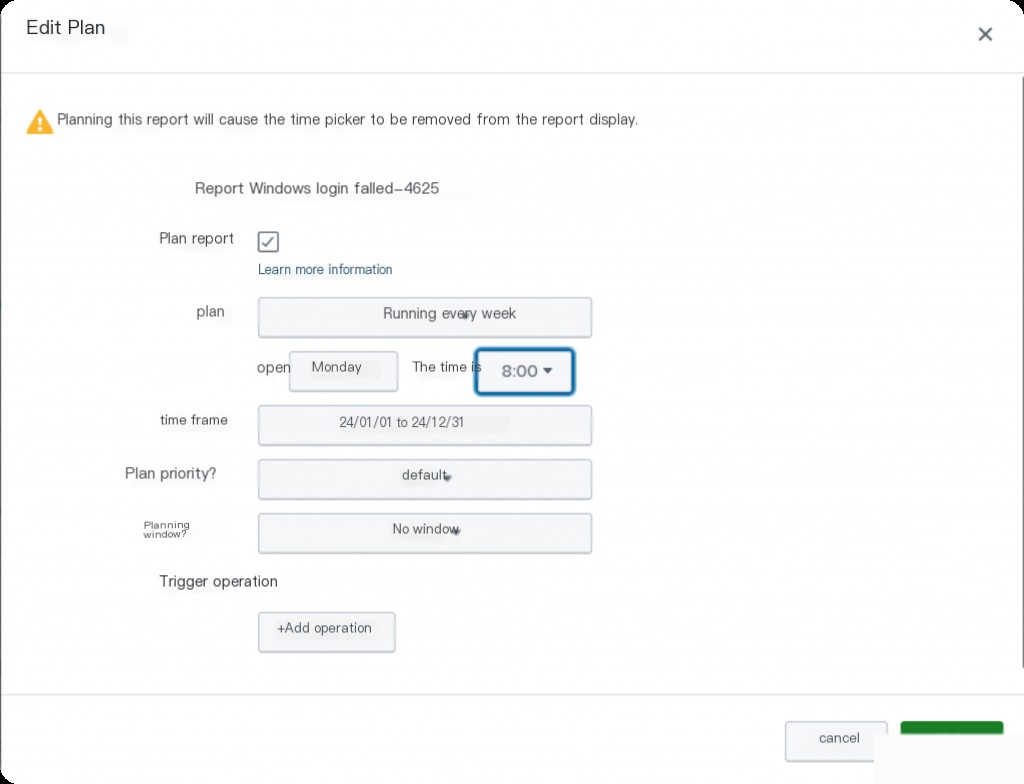
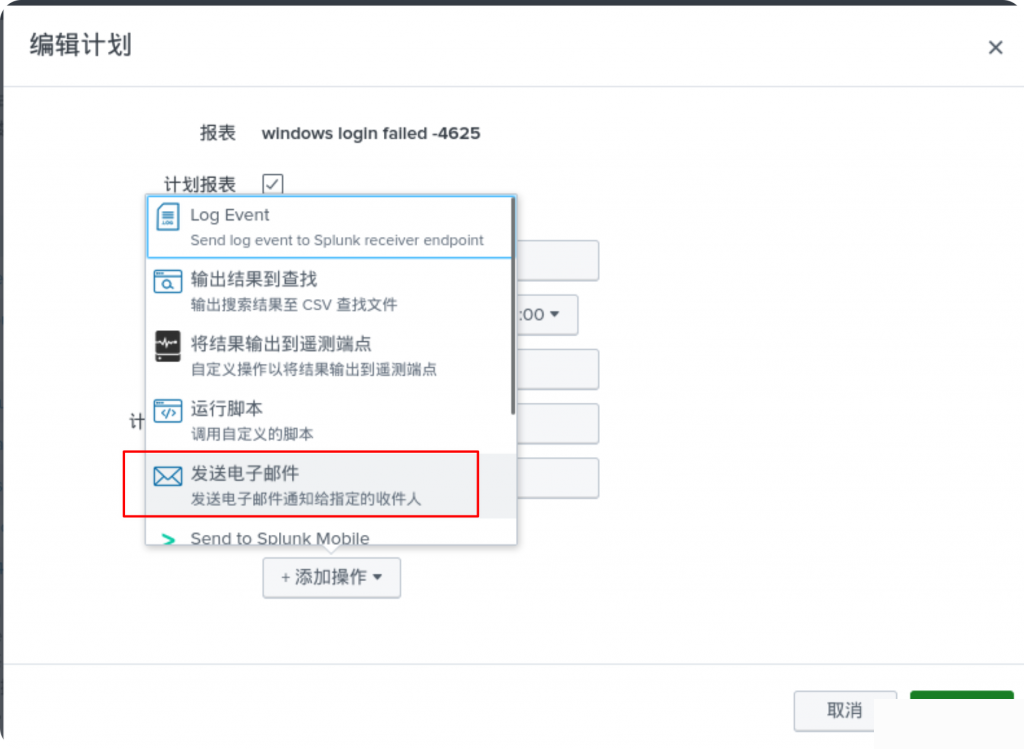
It can also be configured to be sent via email.
Configuring Splunk Alerts
Alerts are saved search results that trigger when certain conditions are met. Alerts can be scheduled or triggered in real-time. In this case, be careful not to overload the Splunk server.
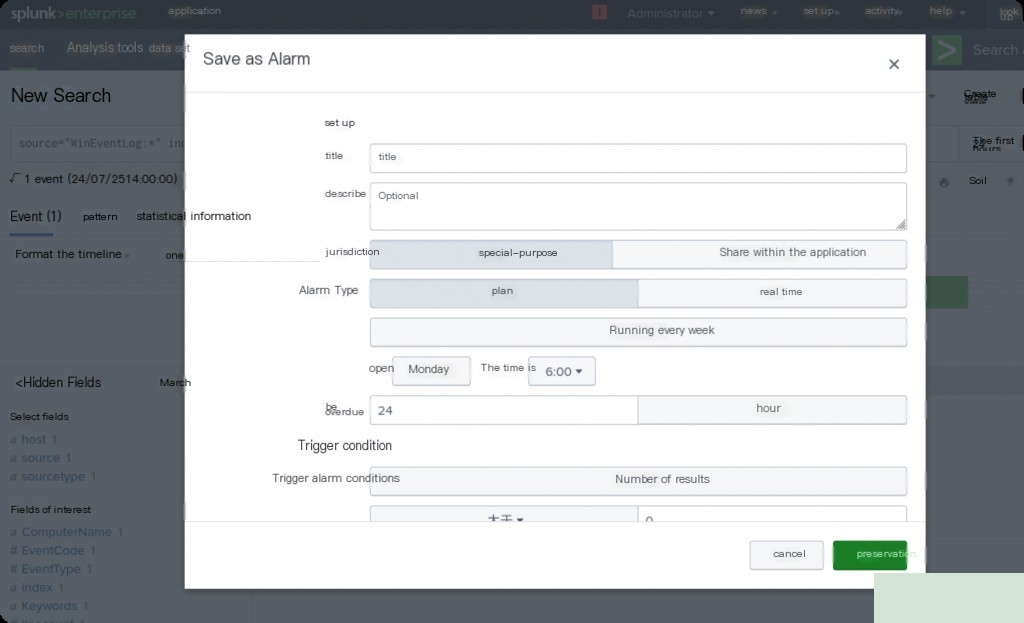
Just select Alert when saving.
Supplement
Modifying the Configuration Forwarding File
If you did not configure the forwarding port 9997 during the initial installation of the Splunk Universal Forwarder, you can configure it later by following these steps:
Open the configuration file for the Splunk Universal Forwarder: On Windows, the configuration file is usually located at C:\Program Files\SplunkUniversalForwarder\etc\system\local. Edit the outputs.conf file (if the file does not exist, you can create one).
Configure the outputs.conf file: Open or create the outputs.conf file and add the following configuration:
 [tcpout]
defaultGroup = splunk_indexers
[tcpout:splunk_indexers]
server = :9997
Here is the hostname or IP address of your Splunk server.
Then restart the Splunk Universal Forwarder for the configuration to take effect. On Windows, you can find the SplunkForwarder service in the Services panel and choose to restart it.
Restart Splunk
Restart Splunk on Windows
“C:\Program Files\SplunkUniversalForwarder\bin\splunk” restart
Restart Splunk on Linux:
sudo /opt/splunk/bin/splunk restart