

Server-Side Packet Capture Scenarios
The diagram below is a typical web architecture. Weatherservice is a server-side application that, upon receiving requests from the browser, initiates requests to the website wthrcdn.etouch.cn and returns the response data to the browser:
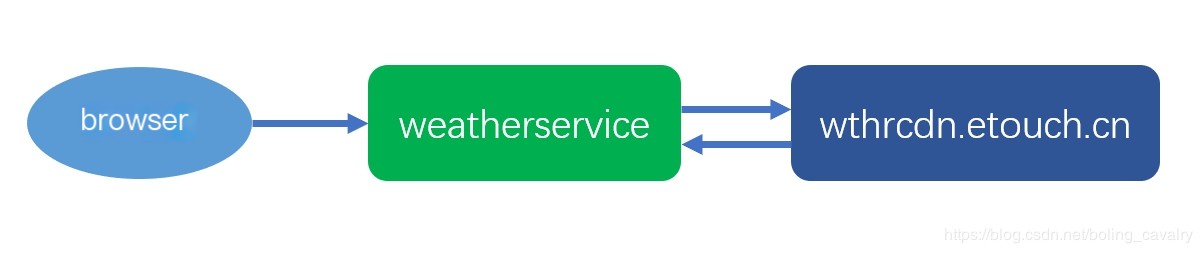
During the development and debugging of the aforementioned application, packet capture analysis between weatherservice and the wthrcdn.etouch.cn website is necessary. The following sections will provide practical steps for packet capture and analysis.
About the weatherservice Application in This Practice
Weatherservice is a Java backend service based on Spring Boot. For details, please refer to “Spring Boot Application to Query City Weather”;
Packet Capture
- SSH login to the server where the weatherservice application is located. In my case, it’s CentOS7;
- Run the following command to install the packet capture tool tcpdump:
Code Language: JavaScriptCopy
yum install -y tcpdump- Run the command `ip addr` to view the network card name. As shown below, mine is ens33:
Code Language: JavaScriptCopy
[root@localhost ~]# ip addr1: lo: <LOOPBACK,UP,LOWER_UP> mtu 65536 qdisc noqueue state UNKNOWN group default qlen 1000 link/loopback 00:00:00:00:00:00 brd 00:00:00:00:00:00 inet 127.0.0.1/8 scope host lo valid_lft forever preferred_lft forever inet6 ::1/128 scope host valid_lft forever preferred_lft forever2: ens33: <BROADCAST,MULTICAST,UP,LOWER_UP> mtu 1500 qdisc pfifo_fast state UP group default qlen 1000 link/ether 00:0c:29:6a:5f:93 brd ff:ff:ff:ff:ff:ff inet 192.168.119.160/24 brd 192.168.119.255 scope global noprefixroute dynamic ens33 valid_lft 1358sec preferred_lft 1358sec inet6 fe80::1646:1c58:ee87:bc13/64 scope link noprefixroute valid_lft forever preferred_lft forever- Execute the following command to start capturing packets on the ens33 network card and save them to a file named weatherservice.cap:
Code Language: JavaScriptCopy
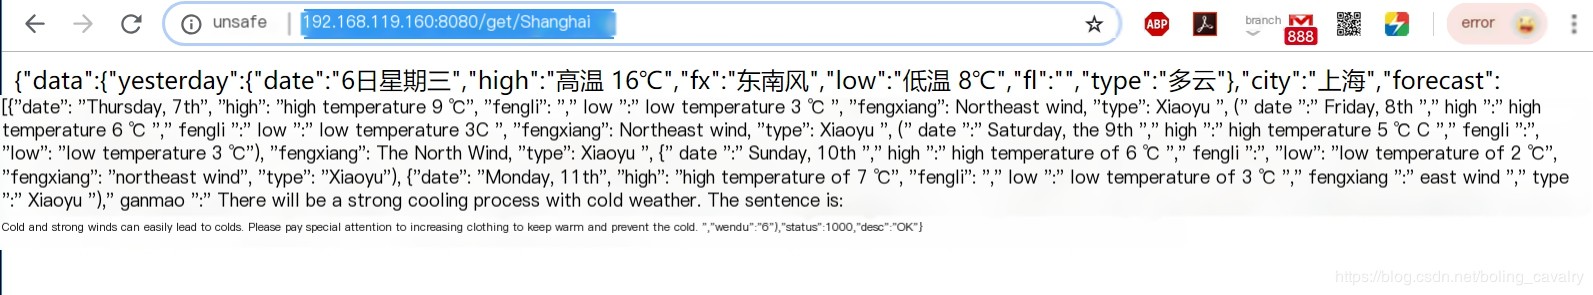
tcpdump tcp -i ens33 -w ./weatherservice.cap- Packet capturing is now in progress. We open the browser and send several requests so that we can capture the request and response between weatherservice and the wthrcdn.etouch.cn website. As shown in the diagram, the address is: http://192.168.119.160:8080/get/上海
- Return to the SSH window, press ctrl+c to end the packet capture;
- The captured data is in the file weatherservice.cap, which needs to be downloaded to a Windows machine with Wireshark installed;
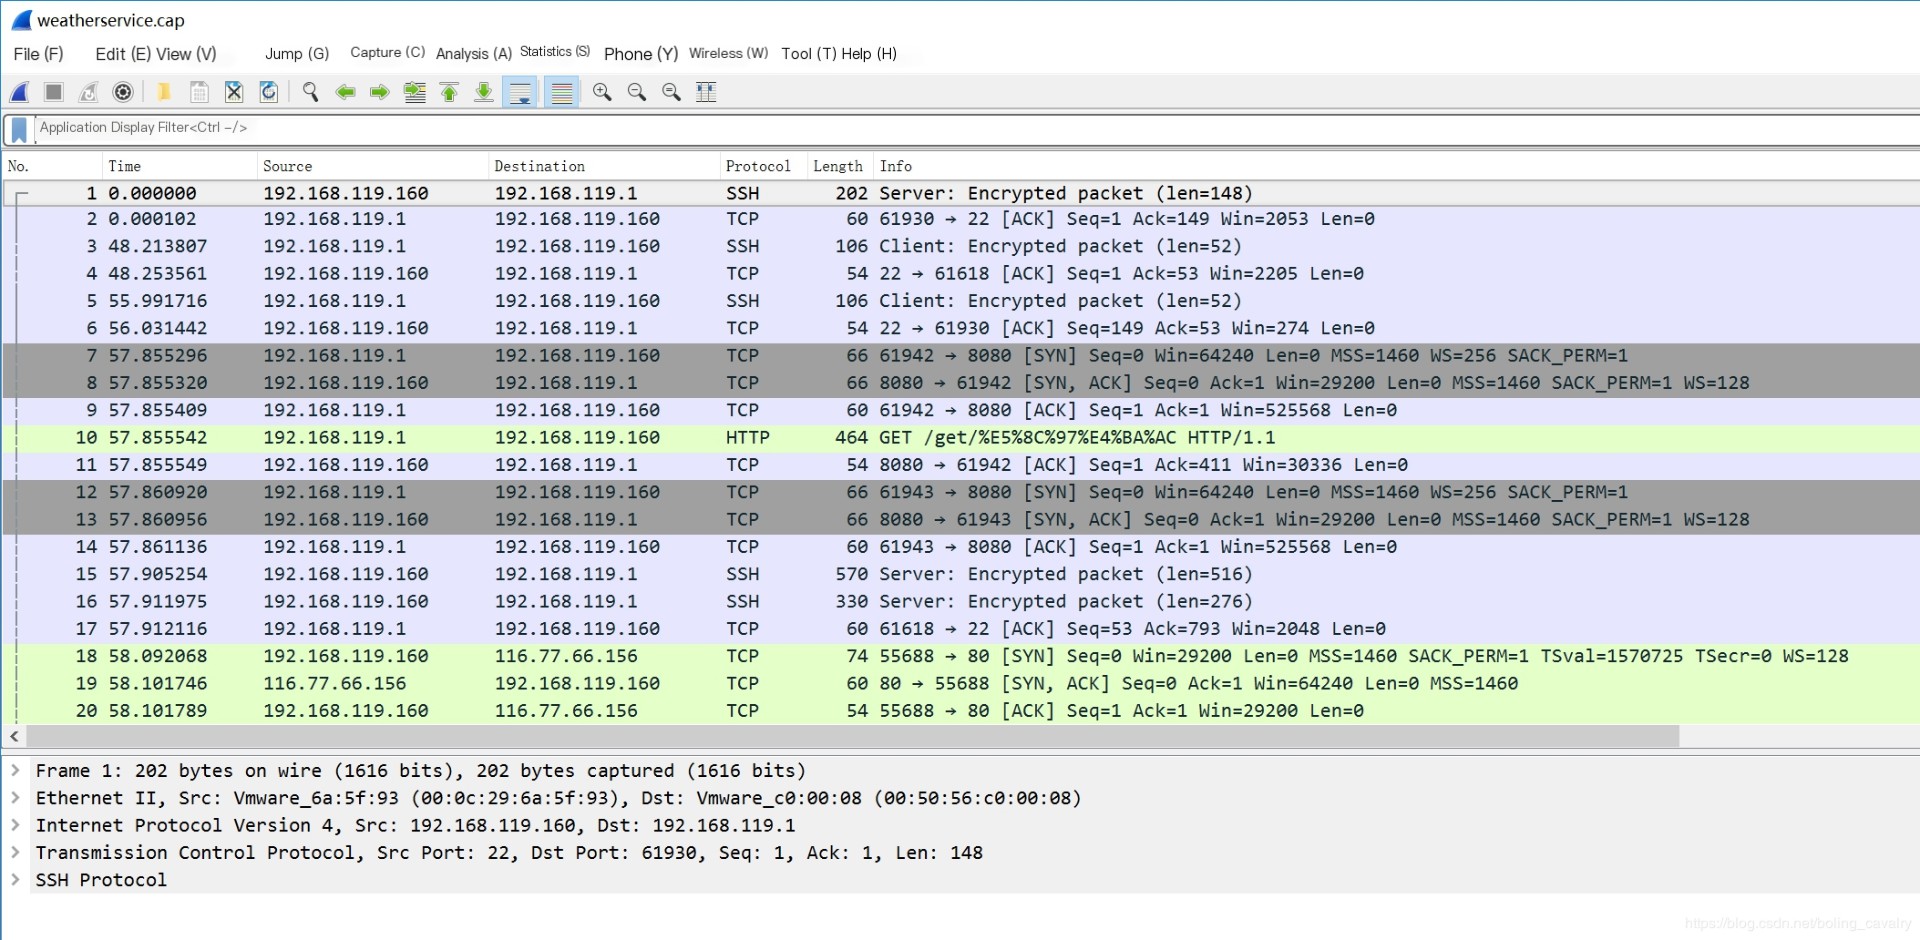
- Open Wireshark, click “File”->“Open”, and select weatherservice.cap, as shown below:
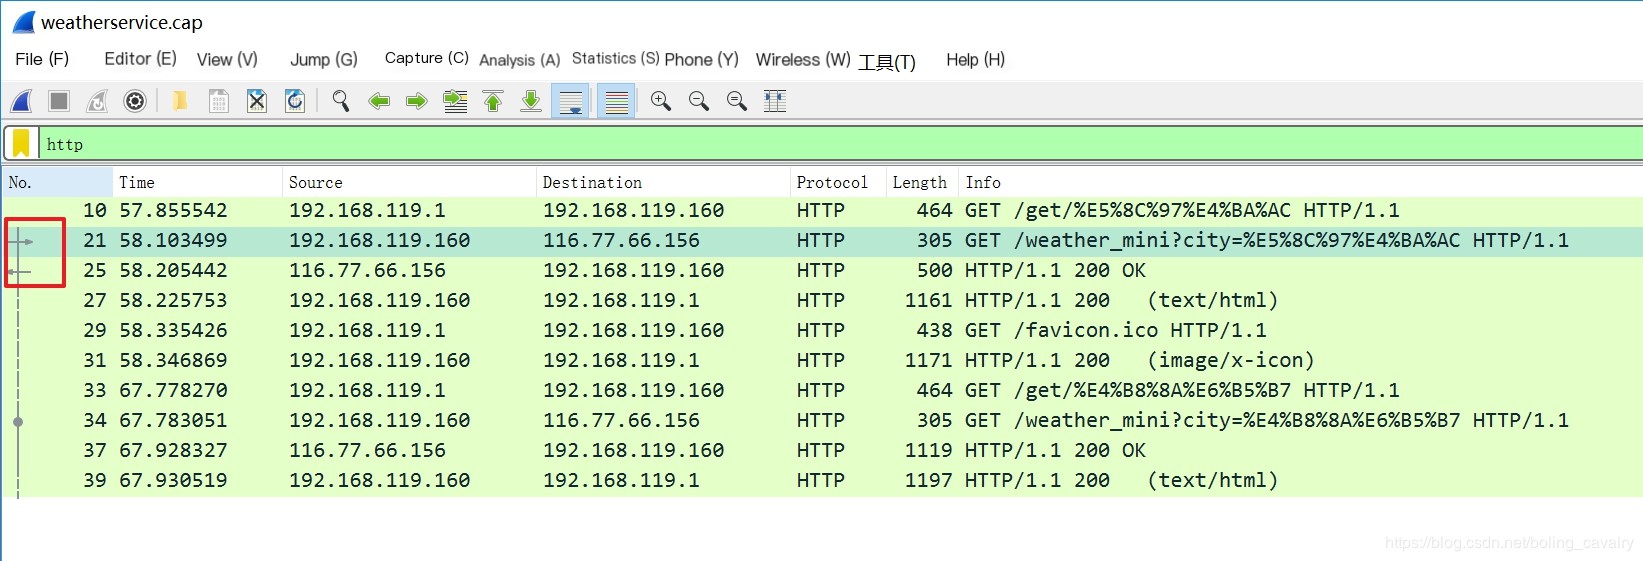
- All network packets on the ens33 network card have been captured, but many are not of interest. We need to filter them, which is simple: only retain HTTP request-response levels, as shown in the diagram, input “http” in the red box, and press enter:
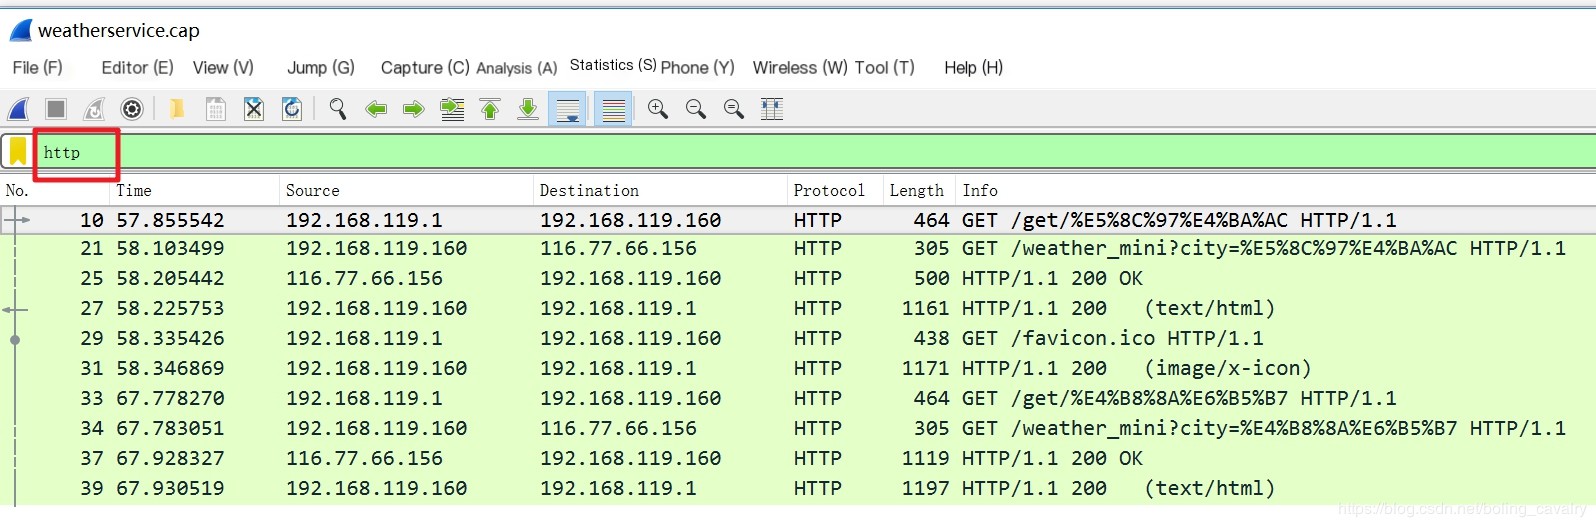
- As shown in the red box, packet number 21 is the request from weatherservice to wthrcdn.etouch.cn, and packet number 25 is the response from wthrcdn.etouch.cn (the gray arrow in the red box indicates a pair of request-response):
- Double-click on packet 25 in the diagram, and the pop-up window shows the detailed response data from the wthrcdn.etouch.cn website. As illustrated, Content-encoding: gzip\r\n in the red box indicates that the body of this response is gzip compressed:
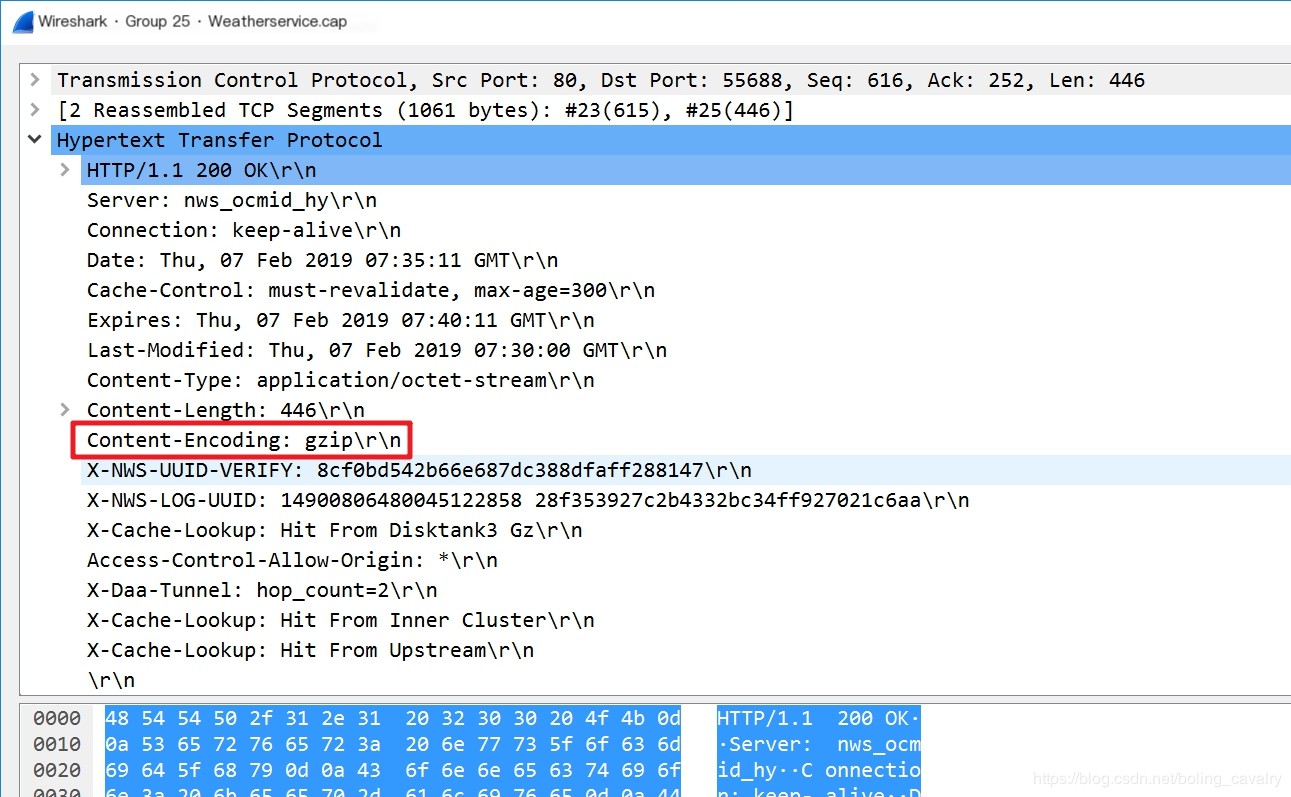
- Some users have noticed that while using Spring Boot’s RestTemplate to access the wthrcdn.etouch.cn website for weather queries, the response data is printed out as garbled characters. This is because the gzip content was not handled. In this article, we have identified the root cause through packet capture, and the solution can be found in the article “Spring Boot Application to Query City Weather”;
- Since the content is gzip compressed, you cannot see the actual content before compression in the pop-up window above. To view the actual content before compression, follow the steps below;
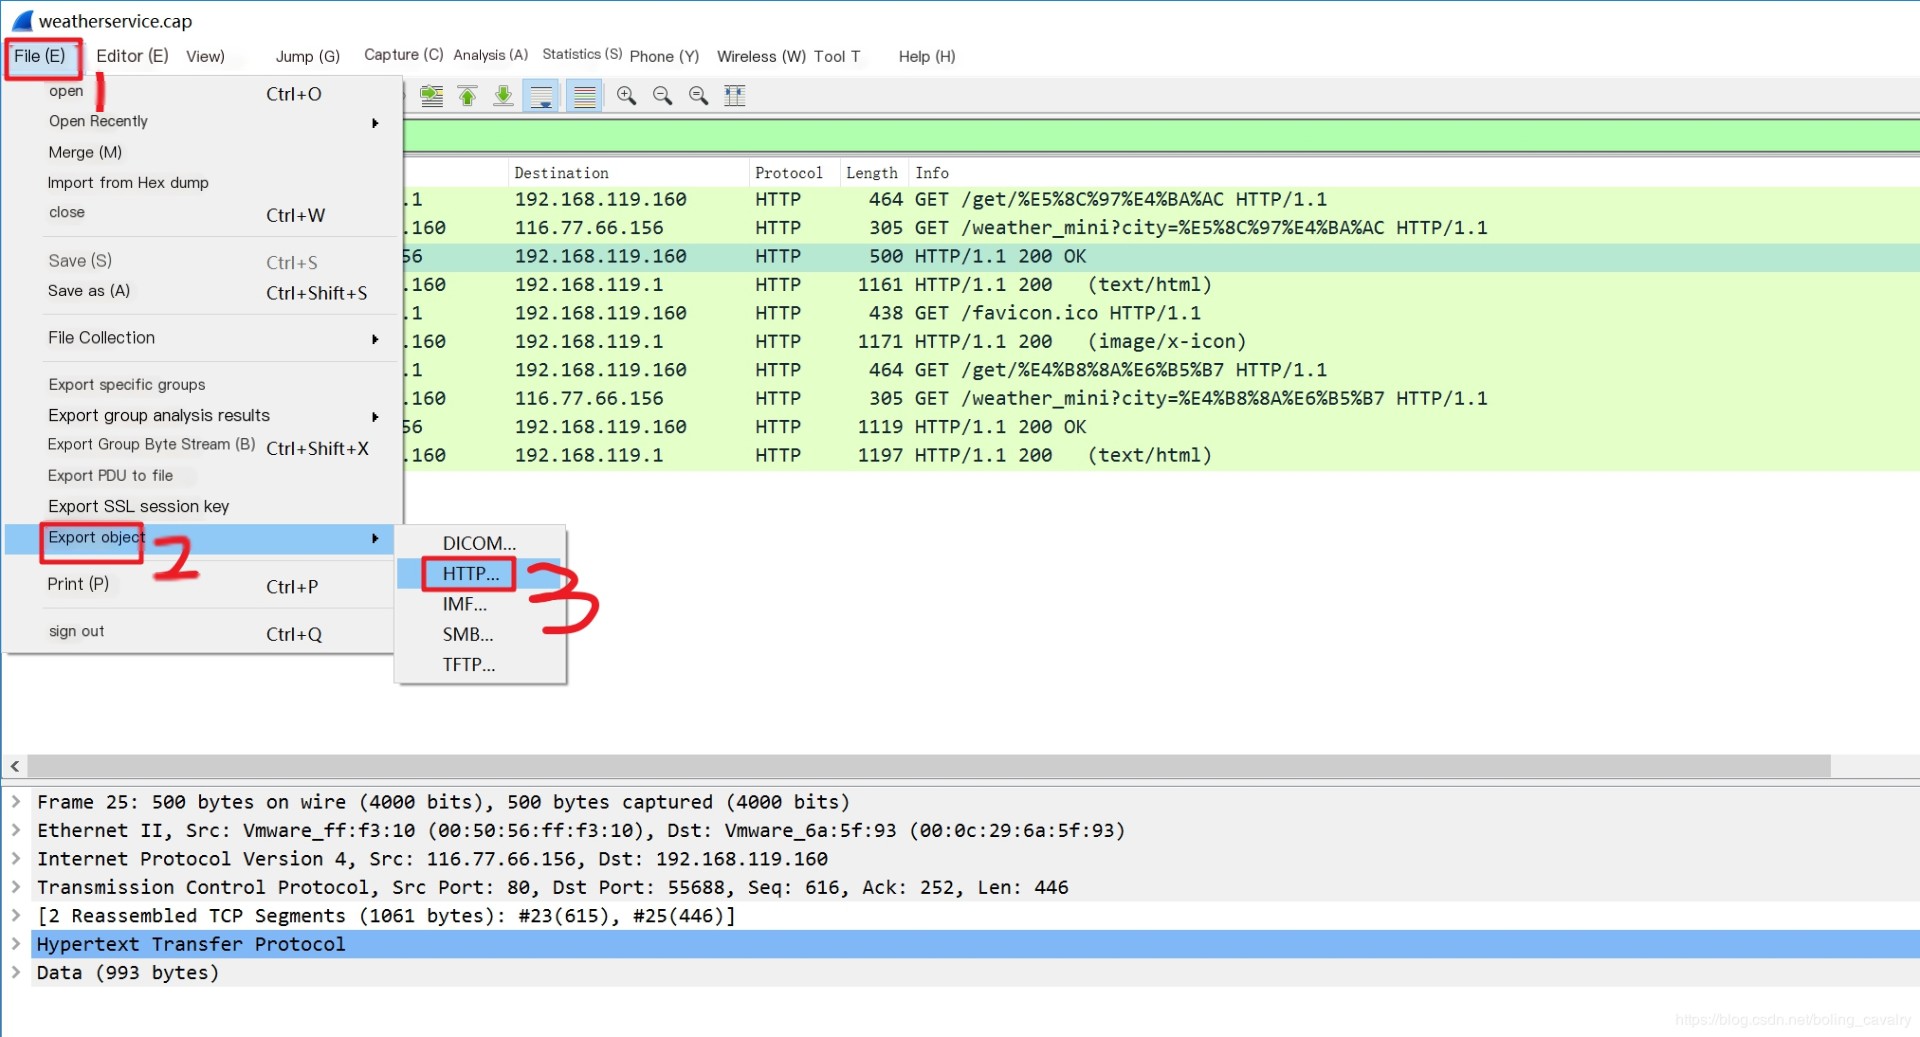
- Close the popup window, return to the main Wireshark window, select “File”->“Export Objects”->“HTTP…” in the menu, as shown below:
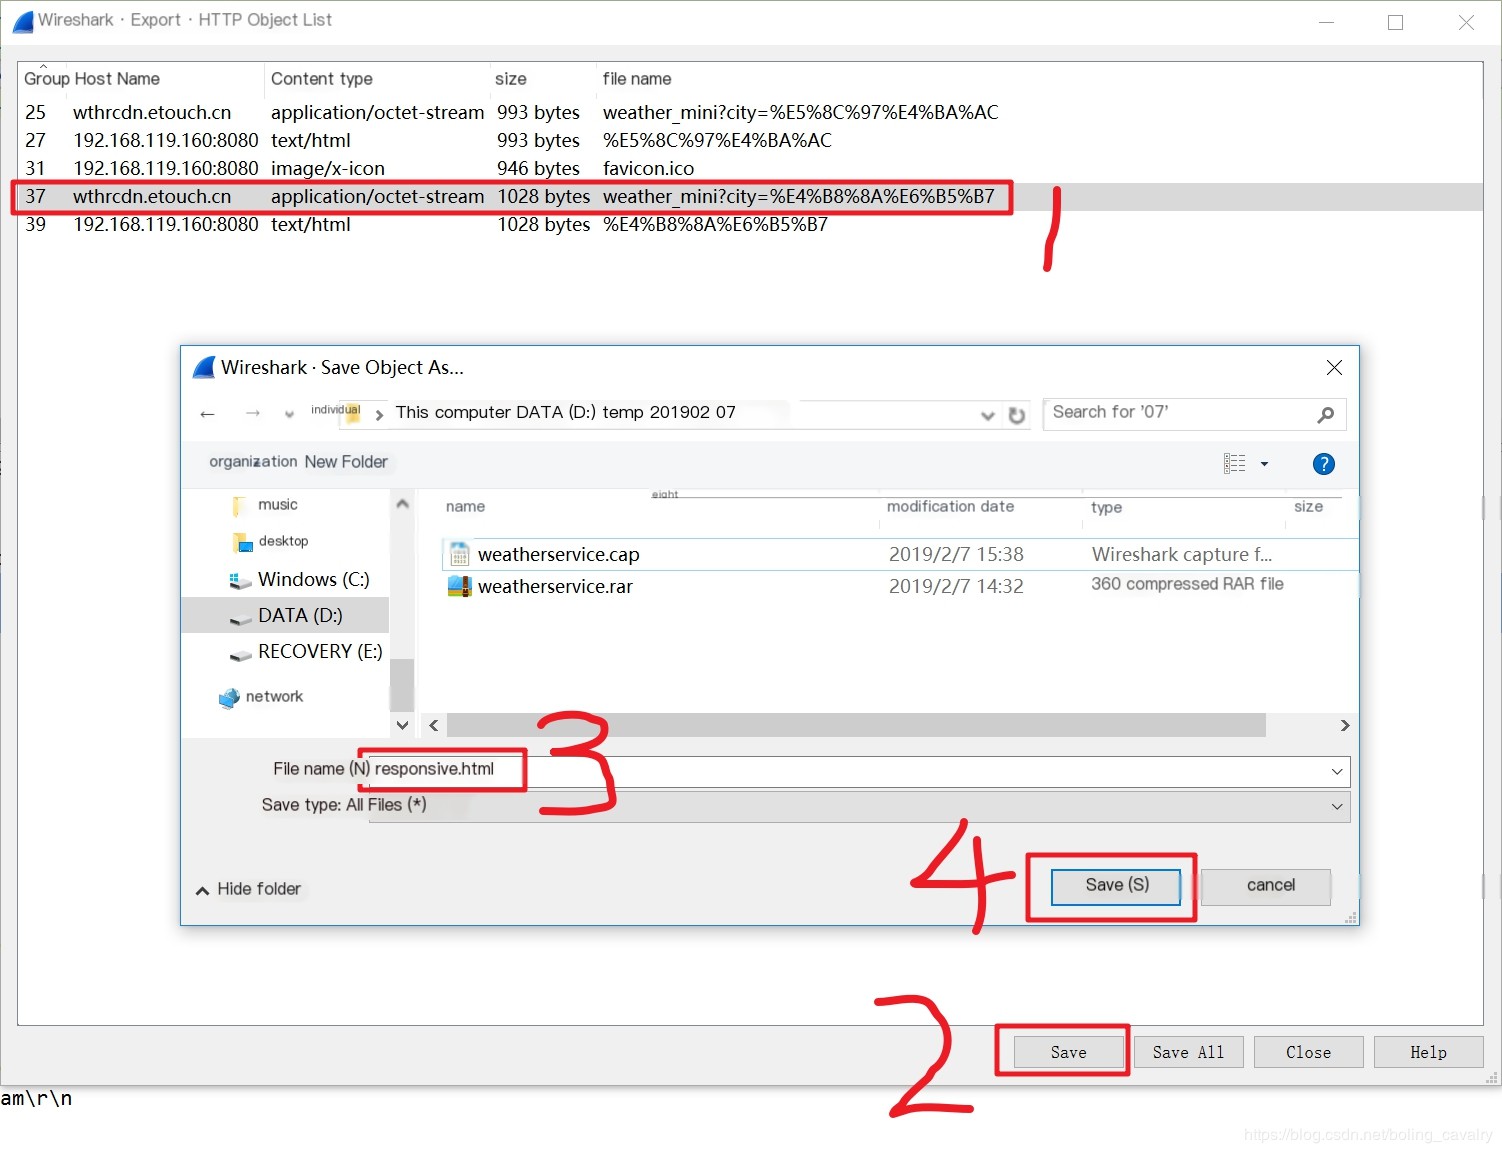
- As shown below, in the pop-up window, select the packet to be viewed and click the “save” button at the bottom. Give the file to be exported a name (with a .html extension), and then click “save”
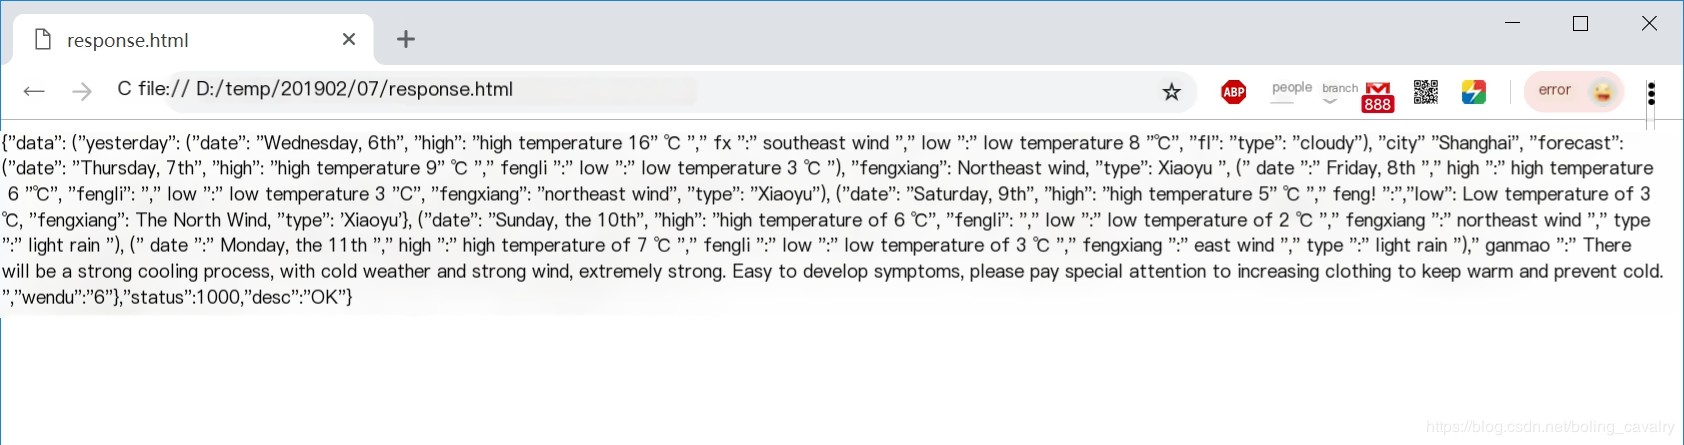
- Open the previously saved response.html file in a browser to see the entire decompressed body content, as shown below:
That’s all for this practical demonstration of packet capturing on Linux and packet analysis with Wireshark. It is hoped that this article can provide some reference during your development and debugging of server-side remote calls.