

As a network engineer, we face numerous unusual issues daily. To help identify the root cause, Wireshark has become a dependable tool in our everyday tasks. This article will introduce three common actions I often perform while using Wireshark, focusing on packet capture optimization.
When starting packet capture, ensure you only capture what you need. To keep the capture file accurate and small, you can change the packet size:
Click on [Capture]:
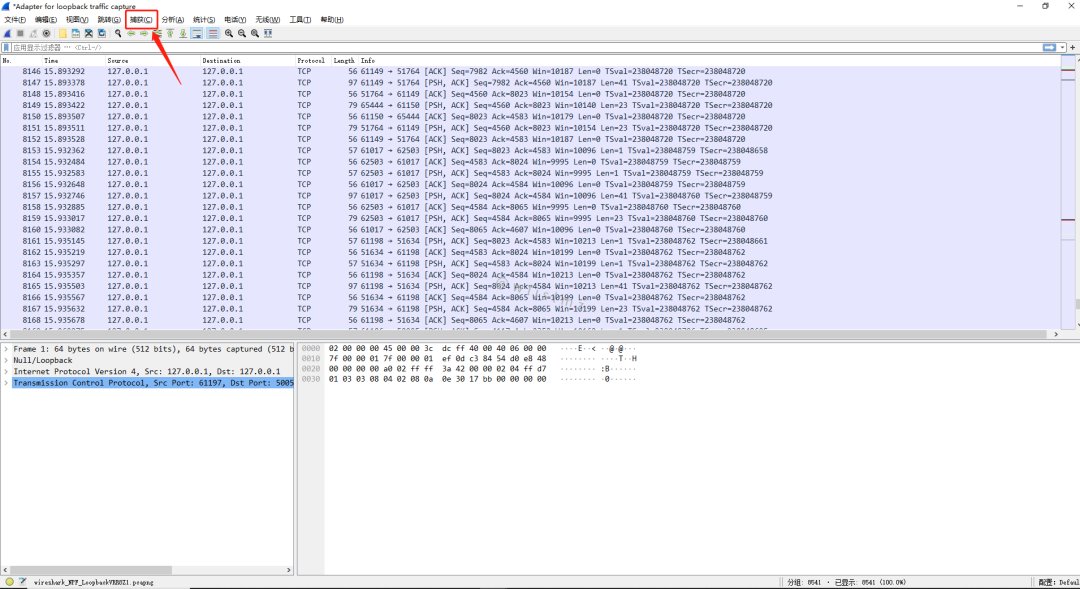
Click on [Options]:
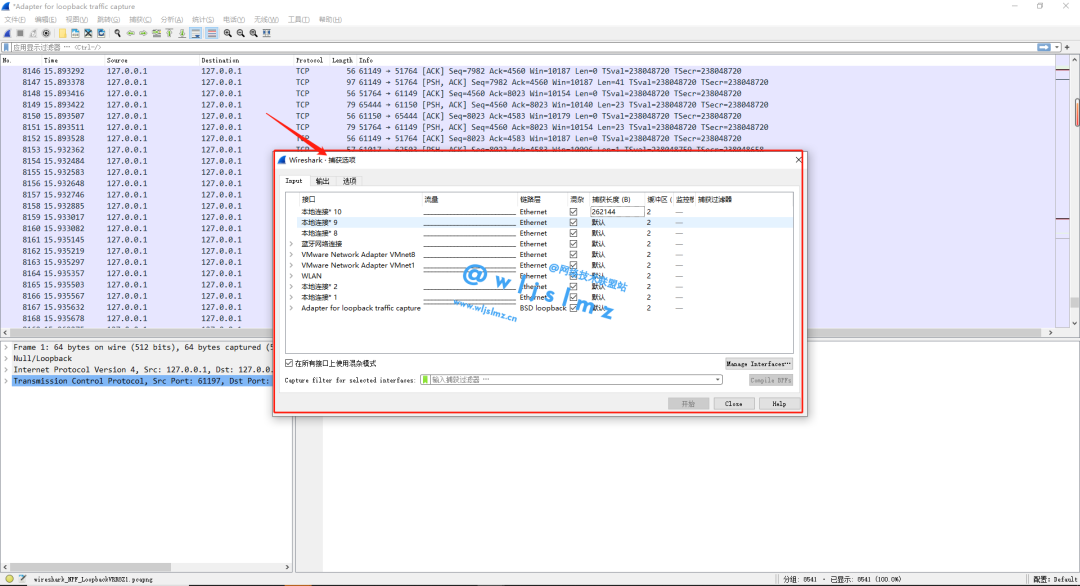
In the “Input” tab, we see that “Capture Length” is where we want to set it:
Capture length is the amount of data from each frame that the network capture tool actually captures and stores in the CaptureFile.
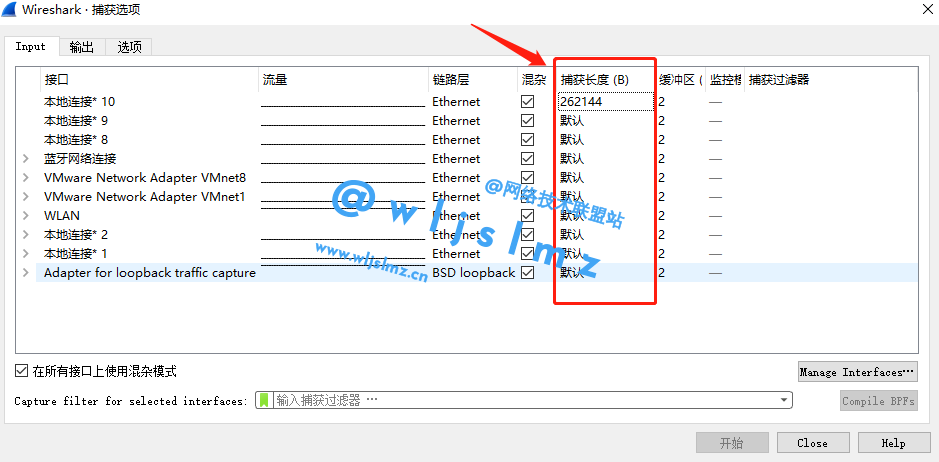
The default size for frames can be seen as 262144B. To optimize it, I recommend setting it between 80-200:
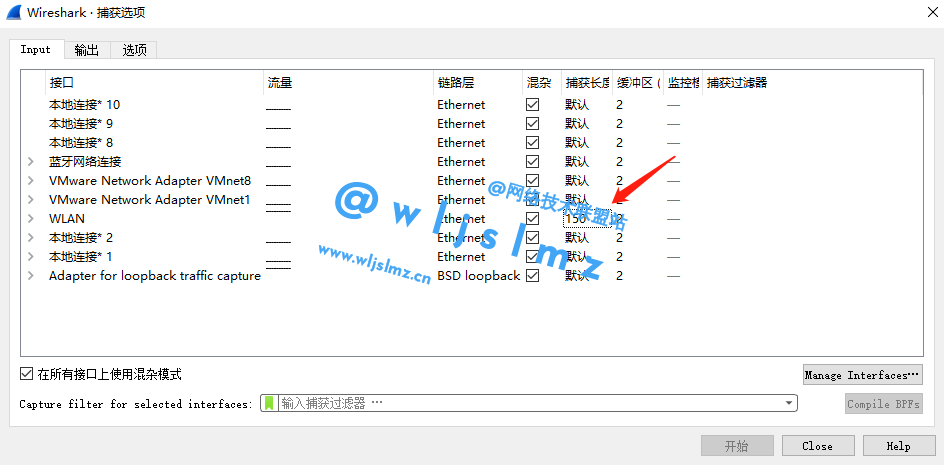
This optimization makes the frame include smaller data packets from the TCP layer, network layer, and data link layer, facilitating efficient analysis.
Once you finish capturing, finding what you actually want can be challenging. Highlighting these packets in different colors is a good choice to identify them.
So how do you set it?
Click on [View] in the navigation bar:
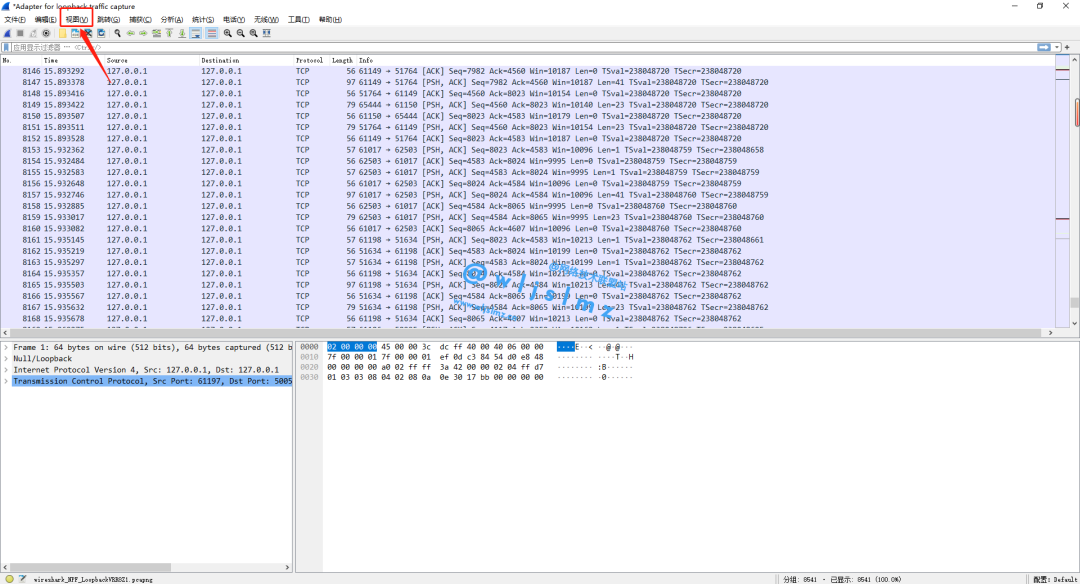
Select and click on [Coloring Rules]:
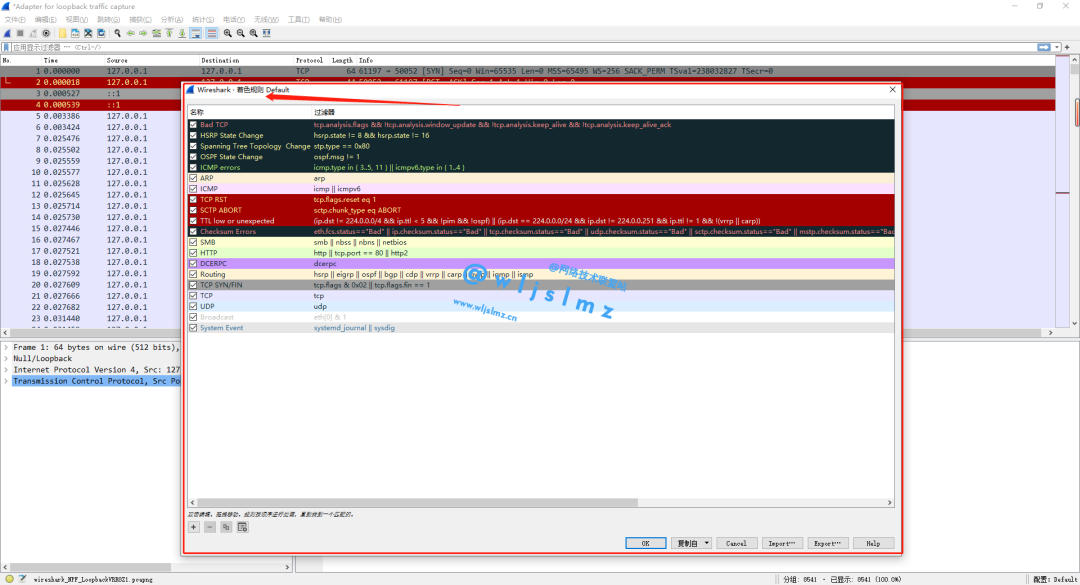
As you can see, some predefined color rules already exist, just like what we see now:
Double-click to edit or add your own, and you will see that color rules are related to filters.
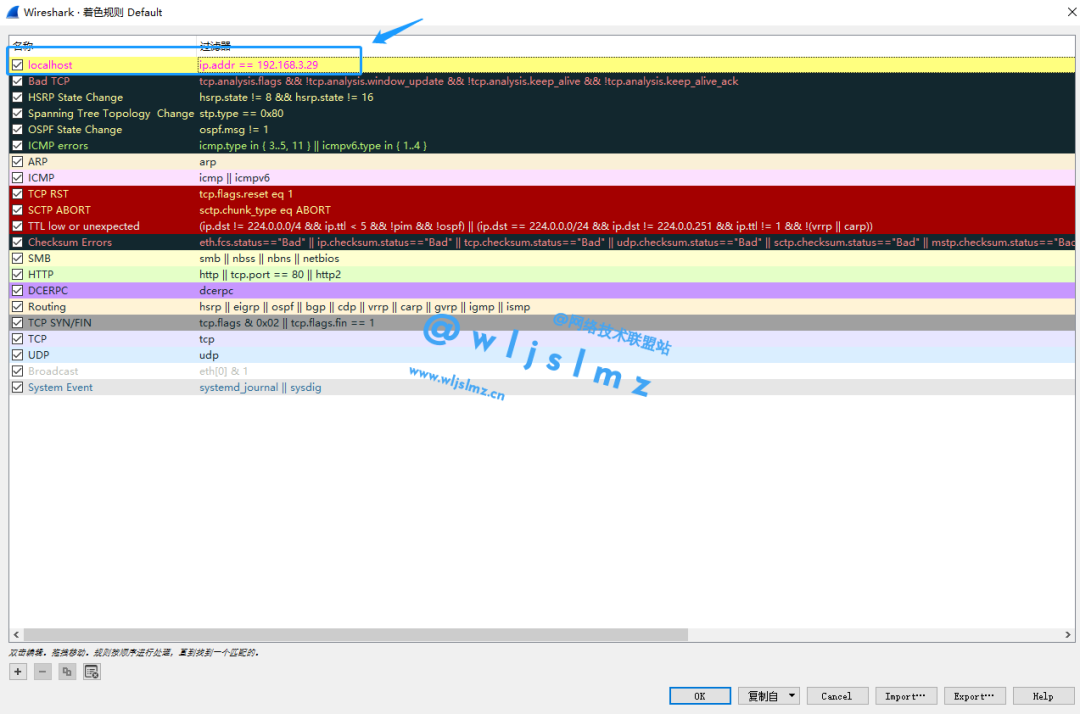
As shown above, I added a coloring rule named “localhost,” with the filter “ip.addr == 192.168.3.29.” This is my local private IP address, meaning that when packets involve my local address, they will be highlighted. Let’s try it out:
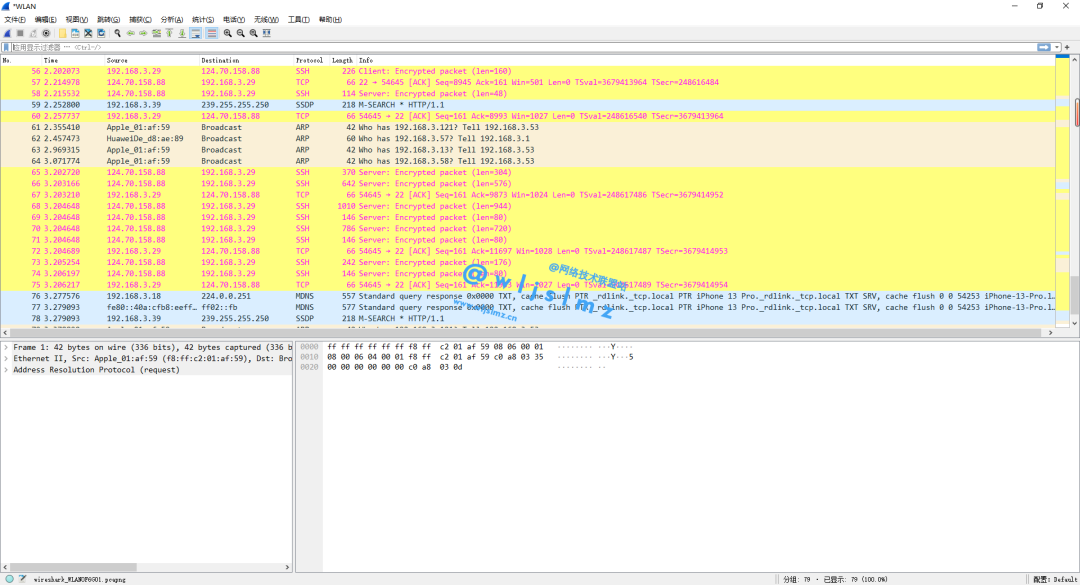
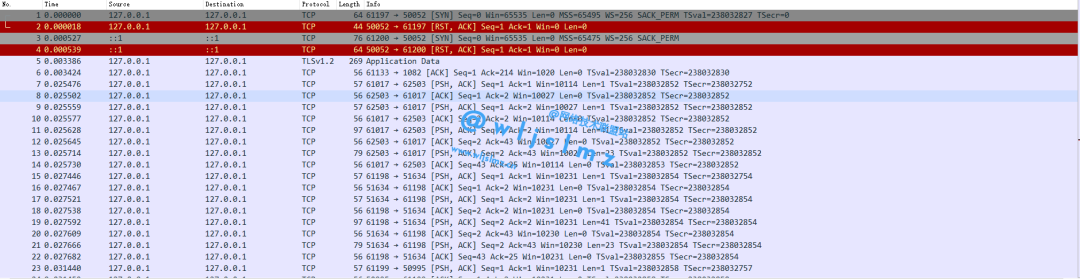
You can clearly see that the coloring rule we set has taken effect!
Wireshark has many filters, but we can’t remember all of them. Although Wireshark provides them within, you can check them at this site:
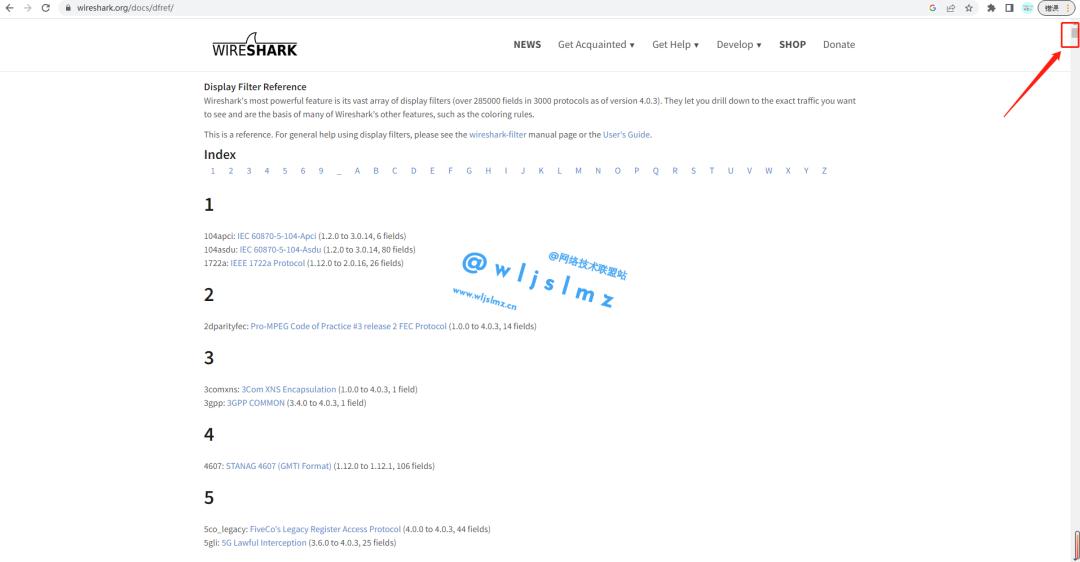
However, as you can see from the progress bar size, the rules are really numerous, making it unrealistic to learn them all.
Let’s briefly introduce how I usually use it.
In general, the data you see in the Wireshark interface is usually sufficient for your analysis. Therefore, in most cases, you can filter based on the interface data like this:
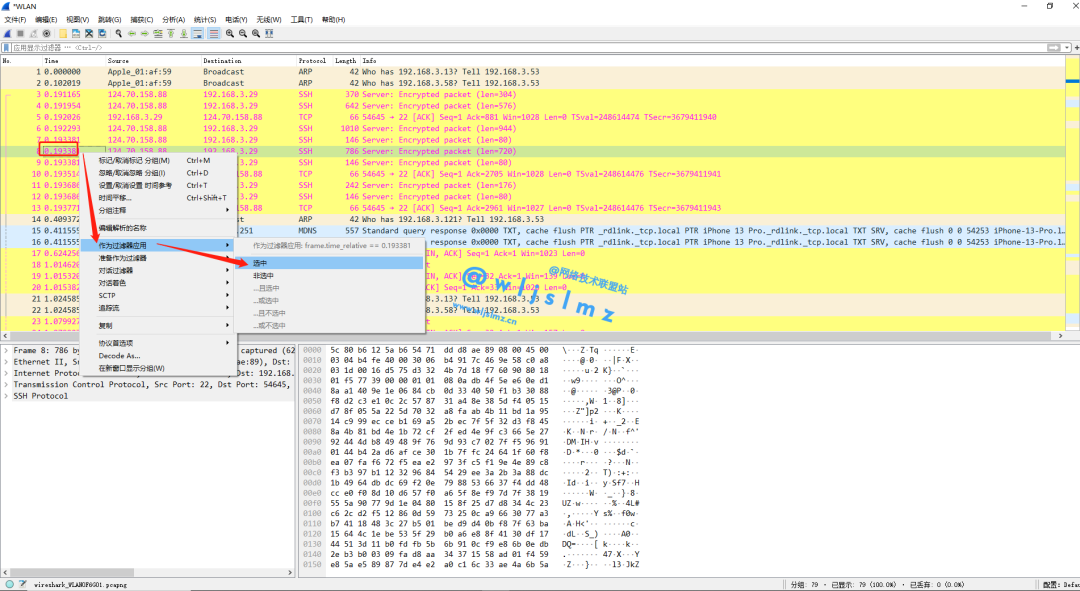
For example, look at the screenshot below:
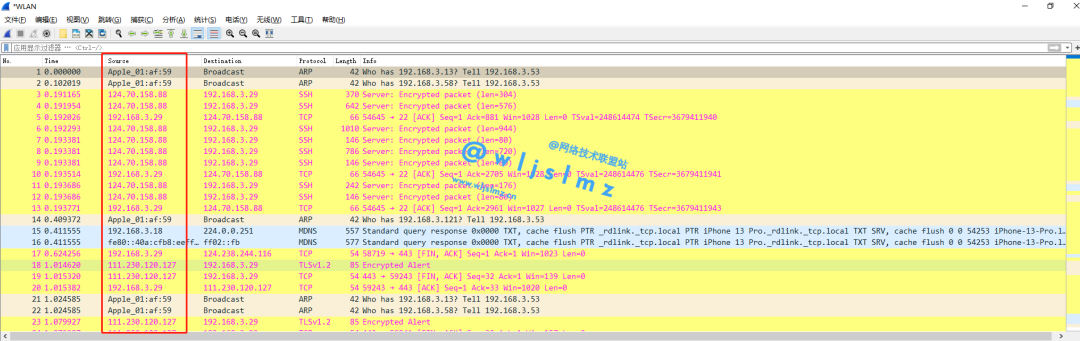
In the source column, there are many IPs. If you want to filter the packets with a specific source IP, just hover over any address in the source column, right-click, choose “Apply as Filter,” then select “Selected”:
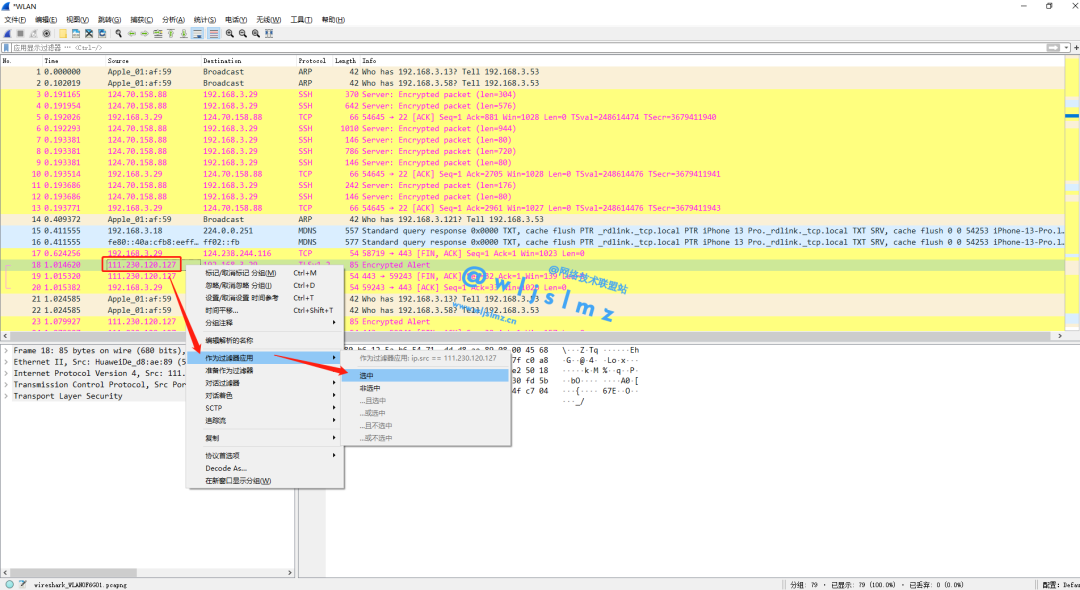
You will then see the filter edit box automatically populate, and all packets with the source IP are filtered:
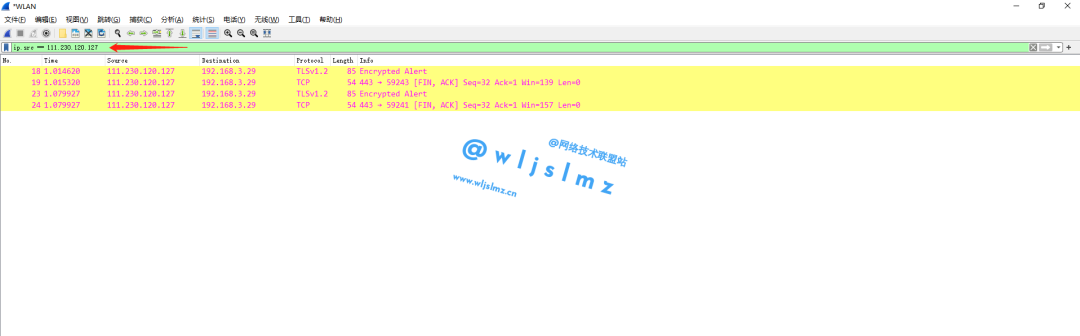
It’s just that simple – there’s no need to remember how to write rules for “source IP filter.”
For example, if we want to filter out packets with a frame arrival time of 0.193381, we can use the same method to filter:
Filtering results:
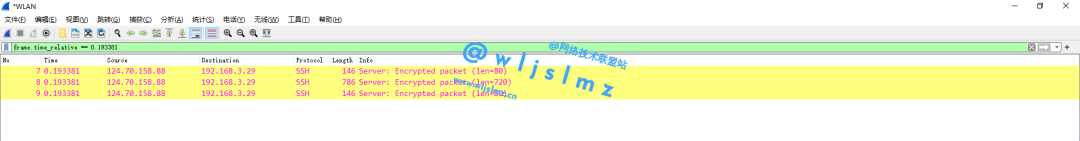
Isn’t that simple and convenient?
Alright, today we’ve shared these three tricks. Those who are already familiar may have been using them for a while. For those not so familiar, feel free to try them out. If I think of other tricks later, I’ll share them with all of you.