markdown
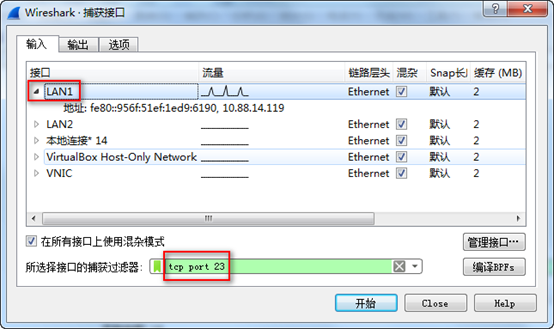
Source: InternetNetwork issues troubleshooting is crucial for maintaining optimal network performance. Tools like Wireshark are widely known for their ability to intercept and analyze network data packets, which helps detect problems such as latency, data loss, and congestion. In cases of network attacks, excessive data downloads, packet loss between devices, or protocol failures, using a packet capture tool like Wireshark is the most direct and effective method to locate the source of the issue.However, despite Wireshark’s powerful capabilities, many network engineers only have a partial understanding of its use and often run into various issues. For example, while Wireshark is commonly used for local packet captures, it also supports remote packet capture via the rpcapd protocol. By installing rpcapd on a remote host, engineers can capture traffic from remote computers as if it were local.Some network engineers might face situations like observing users telnetting into exported devices in an enterprise network and noting incomplete echo responses. This may lead to capturing Telnet packets for analysis. However, capturing all packets at an interface might cause the capturing computer to crash due to high traffic volumes after a short period, often resulting in capturing irrelevant packets.In such cases, using capture filters is necessary to isolate specific traffic or exclude unnecessary traffic. The steps to apply filters include:1. Open “Capture” → “Options.”2. Select the desired capture interface.3. Enter the filter expression in the “Capture Filter” field for the selected interface.
(2) You can see the packets after applying the capture filter in the capture window, as shown below:

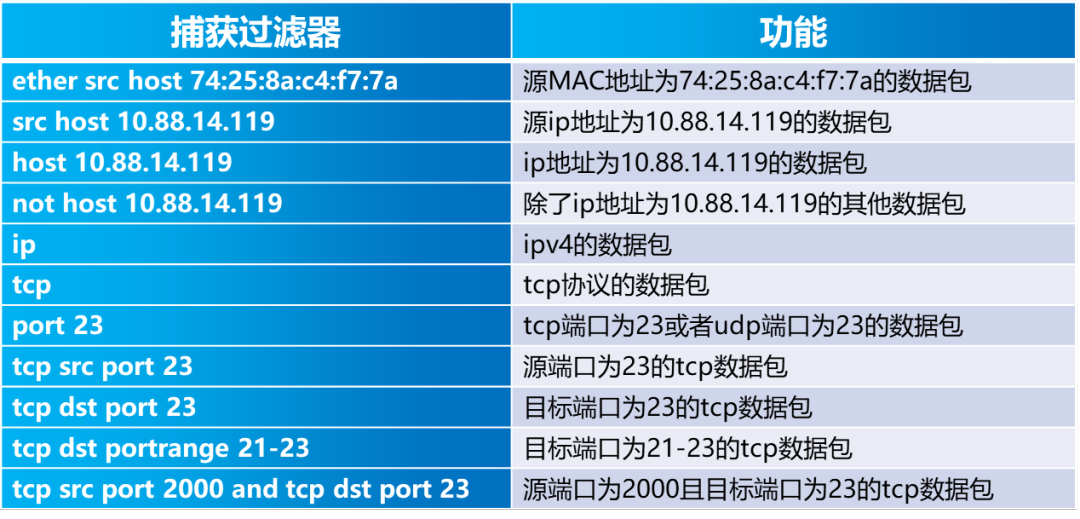
(3) The format of capture filter expressions is: [Logical Operations] + [Protocol] + [Direction] + [Type] + [Value]Logical Operations: and, or, not Protocol: ether, ip, icmp, arp, tcp, udp, etc. Direction: src, dst, src and dst, src or dst Type: host, net, port, portrange, etc.Common capture filter expressions are listed in the table below:
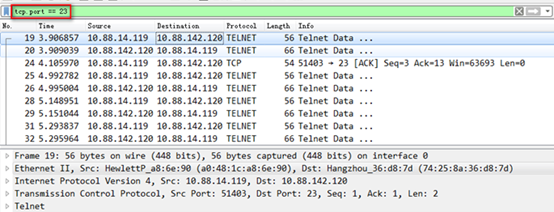
When using Wireshark, it is indispensable to use display filters as you need to find specific packets among a vast number. There are certain situations, such as discovering a lot of failed telnet login attempts on a metropolitan network router, after capturing packets at the export for 2 hours, obtaining a 100M capture file, you extract all the telnet packets for analysis.Looking for them individually would waste a lot of time, but using display filters makes it much more manageable.(1) After opening the capture file in Wireshark, by entering the filter expression in the “Display Filter” field, you can get the packets filtered by the display filter, as shown below:
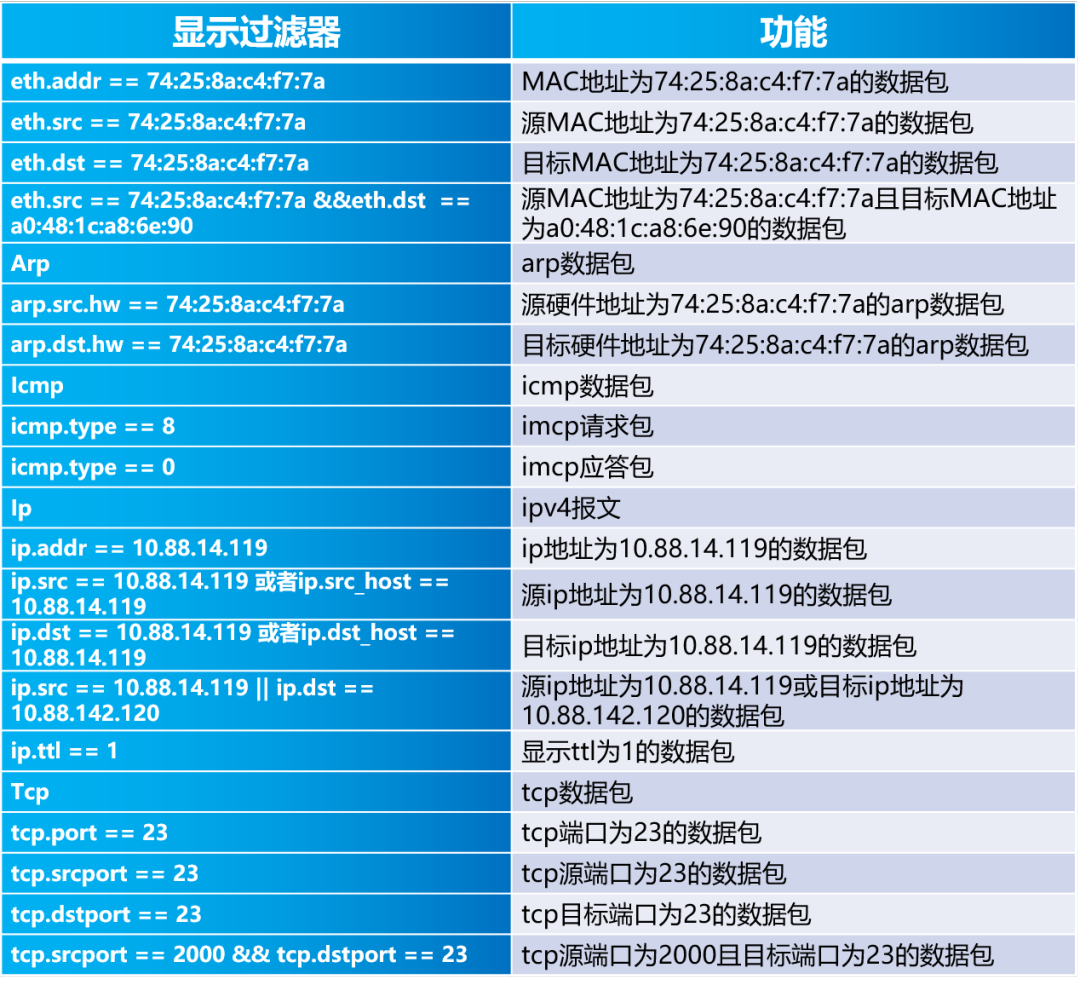
(2) The adage “Sharpening the axe won’t delay the job of chopping firewood” applies here with common display filter expressions listed below:
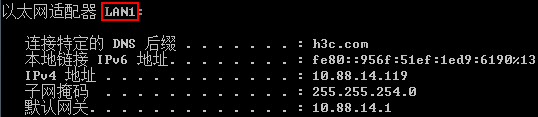
Some enterprise users may encounter issues where the authentication server indicates the billing server is down, with a recurrence period of 7 days, deciding to use packet capture to determine if the issue lies with the connectivity between access equipment and server, or if the server failed to process the radius packets promptly.Capturing packets on the iMC server network card, Wireshark crashes after 2 hours; all the painstakingly captured packets are lost without being saved. In such a situation, using a command-line packet capture can solve it; it writes directly to disk without causing memory overflow issues or process crashes, the steps are as follows:(1) Use ipconfig to check the description of the capture network card, as shown below:
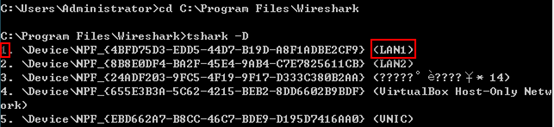
(2) Use the cd command to switch to the Wireshark installation directory and use tshark -D to view the capture network card index number, as shown below:
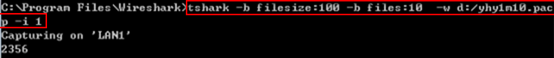
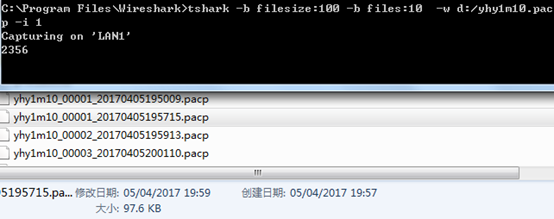
(3) Enter the tshark command to start capturing packetsThe first scenario involves uncertainty in the timing of the issue, with a low frequency and occurring once every few hours or days, and limited disk space. Therefore, we use the loop capture method, continuously capturing and generating specified numbers and sizes of files, overwriting once the specified number is exceeded, recycling the disk space.For example, automatically create a new file every 100KB with a total number of 10 files saved in the D drive’s root directory, automatically overwriting after the limit (occupying 1M of space in total), input the command “tshark -b filesize:100 -b files:10 -w d:/yhy1m10.pcap -i 1” (where -b sets loop capture; Filezise: each sub-packet size (KB); Files: total number of sub-packets; -w specifies the file path and name; -i specifies the network card interface number), as illustrated below:
The second scenario requires long-term packet capture for problem localization, with sufficient hard disk space, hoping to analyze all data on the capture network card. We use a continuous capture method, persistently capturing and generating specified-size files until the hard disk space is full.For example: each file size is 20M, saved to the D drive’s root directory, input the command “tshark -b filesize:2000 -w d:/ yhy20m.pcap -i 1”, and when the issue reoccurs, press ctrl+c to stop capturing packets.(4) You can then analyze the capture files in the designated directory, as shown below with loop capture files:
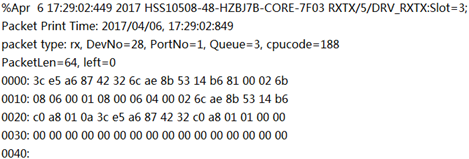
If you discovered persistent timeouts in report packets from a device CPU at some power station, opening the debug switch and obtaining raw binary debugging information but feeling perplexed, as shown below:
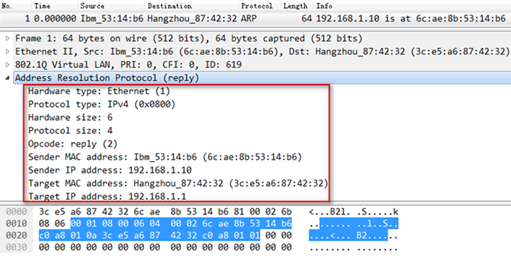
When given a .pcap capture file, opening it allows you to easily discern each field of the packets, as shown below:
If you are not yet familiar with how to use it, the steps are prepared for you:(1) Save the debugging information as a .txt file in the root directory of Wireshark’s installation(2) Use the cd command to switch to Wireshark’s installation root directory, as shown below:

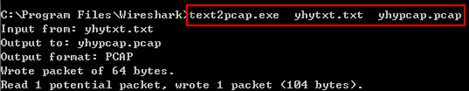
(3) Invoke the text2pcap.exe program to convert the .txt file to a .pcap file, as shown below:
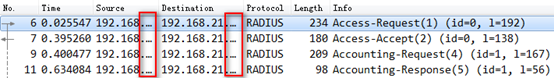
If you love analyzing packets, after opening a capture file, you often find the displayed window column overlap, as illustrated below, where the source and destination IP addresses are incomplete:
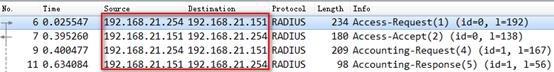
Of course, you can manually adjust them, but it’s not aesthetically pleasing and time-consuming. You might try the shortcut ctrl+shift+R (auto-adjust column width, or “View” → “Adjust Column Width”) for a more pleasing and efficient result, as shown below:
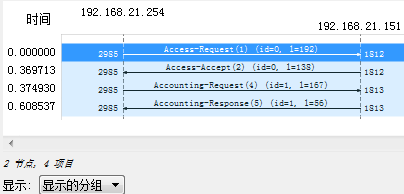
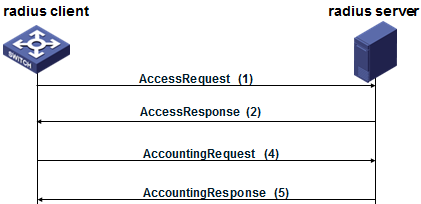
When dealing with authentication anomalies, analyzing RADIUS message interaction is necessary. First draft a diagram, then annotate the messages one by one, and compare them with the standard protocol interaction process for analysis.If the protocol is complex with numerous messages, drawing and annotating it can be laborious and unclear.The traffic graph tool in Wireshark can assist with this drawing and annotation process. After opening a capture file, go to “Statistics” → “Flow Graph,” choose “Displayed Packets,” as shown below, to clearly identify which process has issues by comparing it to the standard RADIUS protocol interaction process.
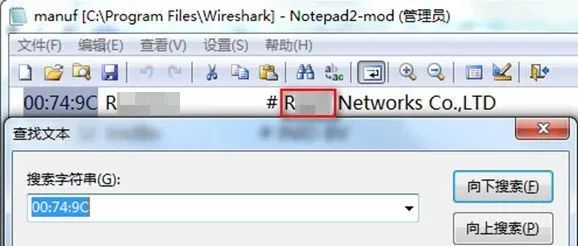
Some colleagues might notice, during WLAN deployment using WirelessMon scanning, that certain MAC addresses beginning with 00:74:9C appear in the same channel as the working one, with high power significantly disrupting their operation.Suppose you want to identify which vendor’s AP it is; the first three bytes of the MAC address serve as the vendor identifier, allowing you to determine the manufacturer.At this point, the manuf file in Wireshark’s installation directory can come into play; querying it reveals that 00:74:9C corresponds to manufacturer R, as shown below:
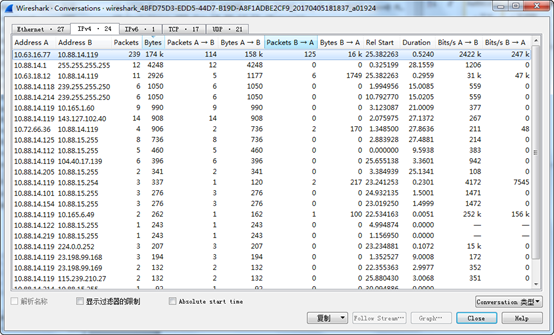
If network traffic in a mall is abnormal, you, as the project in charge, arrive at the site to use Wireshark for a 15-minute capture. Upon analysis, you realize the data packet size reaches 80M, and manually tallying them is inefficient while browsing for a rough impression is unreliable. How to tackle this? Wireshark’s powerful features still have solutions for such challenges. Go to “Statistics” → “Conversations” to ascertain the largest traffic between which IP addresses by packet count and byte size, then focus your checks on those IPs, as depicted below, showing 10.63.16.77 and 10.88.14.119 as having the largest traffic.
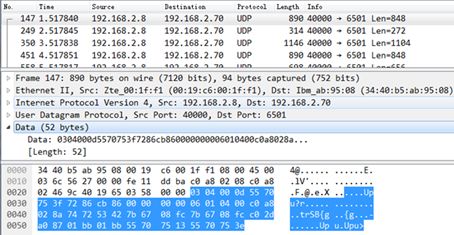
If investigating issues at a train station with servers repeatedly not receiving userlog logs sent by firewalls, you wish to determine if it is due to unresolved server actions or if userlog packets have not arrived, thus enabling packet captures on the server’s network card for observation:(1) At first glance, it’s not obvious that they are userlog packets, seeing the forest for the trees, as shown below:
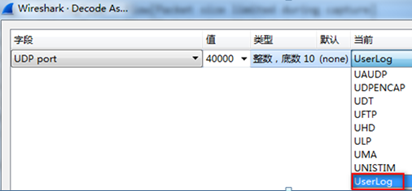
(2) Pay attention to check if the userlog port on the firewall is non-default, upon realizing it, go to “Analyze” → “Decode As,” select the port and corresponding userlog protocol, as shown below:
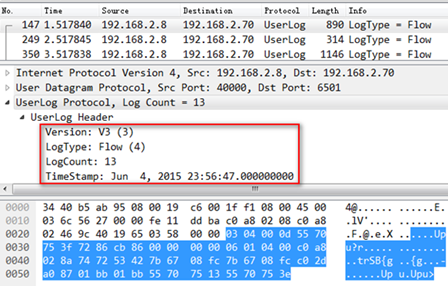
(3) You can clearly see each field of the userlog packets, as shown below. Seeing the forest, realizing it’s just a mountain, the server received the userlog packets but couldn’t parse them.
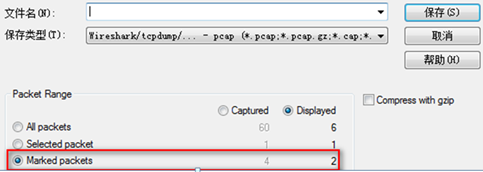
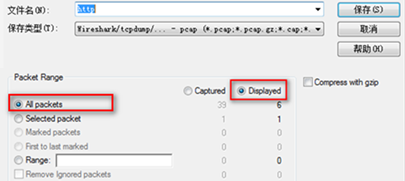
Diligent you have been learning the HTTP protocol recently; you need to filter and save HTTP protocol from the 50M capture file, to better embed it into a Word document for easy reference.(1) After using a display filter, the number of packets is still substantial; go to “File” → “Export Specified Packets,” select “all packets” and “displayed,” then save, as illustrated below:
(2) If only specific packets need saving, go to “Mark Packets” → “File” → “Export Specified Packets,” choose “marked packets” and “displayed,” then save, as illustrated below: