

1. Overview
tcpdump plays a vital role in our regular operational tasks, serving as a crucial tool for diagnosing and analyzing complex issues, making it an indispensable asset in operations.
Simply put, tcpdump is defined as: “dump the traffic on a network,” a packet capture analysis tool that intercepts packets on the network as defined by the user. This article introduces tcpdump from two perspectives: first, a guide to using tcpdump, and then a detailed look at its practical application in MySQL database operations. If a DBA can proficiently use tcpdump, it will surely enhance their operational capabilities.
2. Parameter Description
Command Format:
1.-c: Specify the number of packets to capture, stopping after capturing X packets.
2.-i:interface: Specify the interface tcpdump should listen to, which defaults to capturing the first network interface. Specifying “any” captures packets on all network cards.
3.-P: Specify whether to capture incoming or outgoing packets, with “in”, “out”, and “inout” as specific values. The default is “inout.”
4.-s: Set the number of bytes of the packet to display (snaplength). Setting it to 0 shows the full packet content.
5.-v,-vv,-vvv: Verbose! More verbose! Even more verbose! Redundantly outputs packet information.
6.-w: Output the result file location. The result file is stored in tcpdump format and can be analyzed using Wireshark.
Expression Syntax
A basic expression unit format is: “proto dir type”
Type
host, net, port, portrange
Example: host 192.168.1.1, net 128.2, port 20
Direction
src, dst, src or dst, src and dst
Protocol
tcp, udp, icmp. If no protocol is specified, all possible types are matched.
3. Usage Examples
1. Capture all packets sent and received by host 192.168.94.128.
#tcpdump host 192.168.94.128
2. Monitor packets on the specified host 192.168.94.128 and specified network card
#tcpdump host 192.168.94.128 -i eth0
3. Monitor packets on the specified network card and port
#tcpdump –i eth0 port 8080
4. Monitor all packets sent to 192.168.94.128
#tcpdump -i eth0 dst host 192.168.94.128
5. Monitor communication packets between 192.168.94.128 and 192.168.94.129 or 192.168.94.130
# tcpdump -i eth0 host 192.168.94.128 and \(192.168.94.129 or 192.168.94.130\)
6. Monitor packets on port 3306 of the local machine, capture full packets, and output them to /tmp
#tcpdump -s0 -vv port 3306 -w /tmp/`hostname`.pcap
4. Application in MySQL
Case One
The first topic is the MySQL connection and disconnection process. During actual operations, I encountered issues with abnormal connections due to network problems. When you suspect a network issue, you can analyze with tcpdump. First, let’s take a look at MySQL’s three-way handshake and four-way termination processes (the principles of TCP’s three-way handshake and four-way termination need to be researched independently).
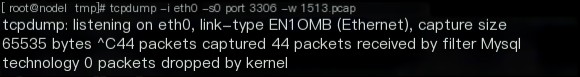
First, run the monitoring command on the MySQL server: tcpdump -i eth0 -s0 port 3306 -w 1513.pcap
 >
>
You can see we captured a total of 44 packets. We download the pcap file to the computer and analyze it using Wireshark.
 >
>
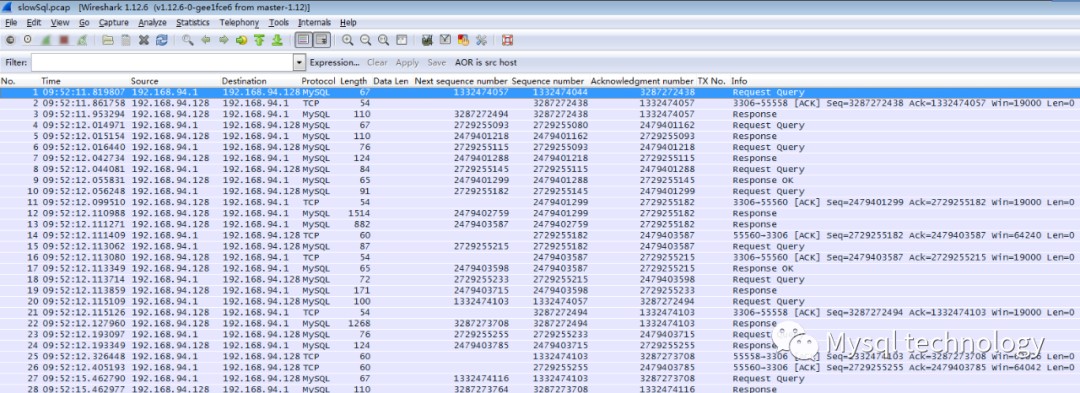
The image shows that 192.168.94.1 is the client and 192.168.94.128 is the MySQL server. The first packet is a SYN packet (Sequence 1803591875) from the client to the server initiating a connection, the second packet is an acknowledgment from the server to the client, sending an ACK packet (Sequence 1803591876) along with a SYN packet (Sequence 93871103) to the client. The third packet is the client responding to the server’s SYN+ACK packet with an ACK packet (Sequence 93871104), thereby establishing a TCP connection. The client and server enter the ESTABLISHED state (TCP connection successful) and begin data transmission.
If the client sends a SYN packet and does not receive an ACK packet from the server, it’s time to check whether the MySQL server and intermediate network are functioning normally.

Next, let’s look at MySQL’s disconnection process. First, the client sends a FIN packet (Sequence 1803593470), to which the server responds with an ACK packet (Sequence 1803593471), indicating the client can no longer send data but can still receive. The server then sends a FIN packet (Sequence 93871103) to the client, which replies with an ACK, completing the four-way termination and closing the connection.
If your application client has many CLOSE_WAIT connections, the MySQL server may have restarted unexpectedly.
Case Two
In actual operations, sometimes the business is slow, and the application side can see that the SQL execution time is long, but the database’s slow log does not capture slow SQL. The likely reasons are that the SQL execution is slow but has not reached the long_query_time baseline, the database executes quickly but the network is problematic, or the SQL execution time in the database is slow. How do you pinpoint this issue? Merely stating the database has no problems is unconvincing; you must present real data as evidence. This is where tcpdump can help pinpoint the issue.
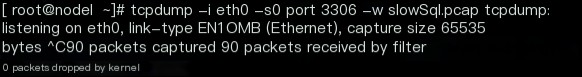
1. Capture packets on the database
tcpdump -i eth0 -s0 port 3306 -w SlowSql.pcap
The application captured a slow SQL, with a duration of about 5.6 seconds, and the SQL executed was: select count(1) from table_test. Stop capturing after the SQL execution.
2. Open the pcap file
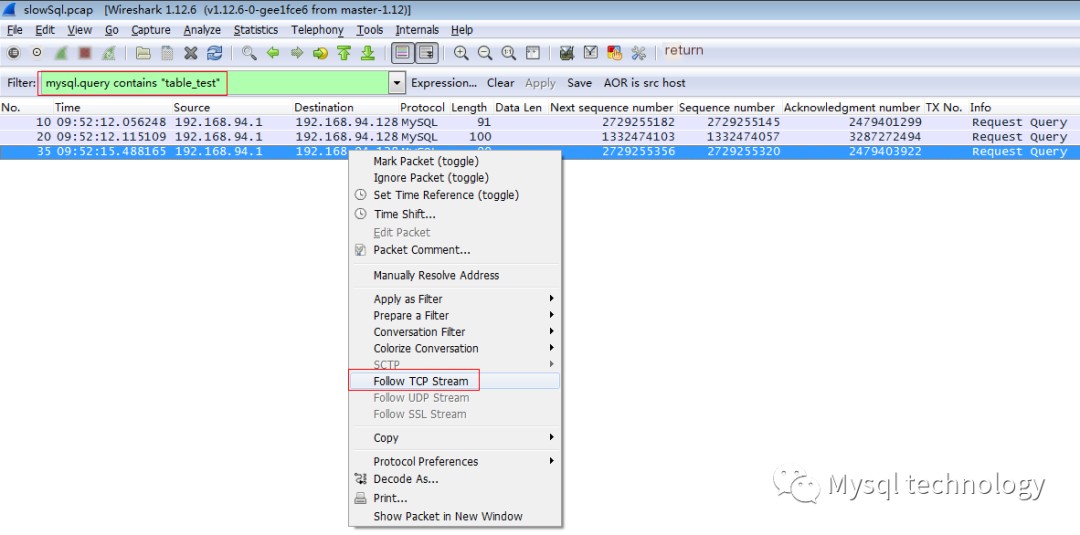
3. Follow the TCP Stream
Search for the keyword “table_test,” find a record, click Follow TCP Stream, and trace the TCP stream
4. Analyze the TCP Stream
We’ll analyze the TCP streams in detail
First record:
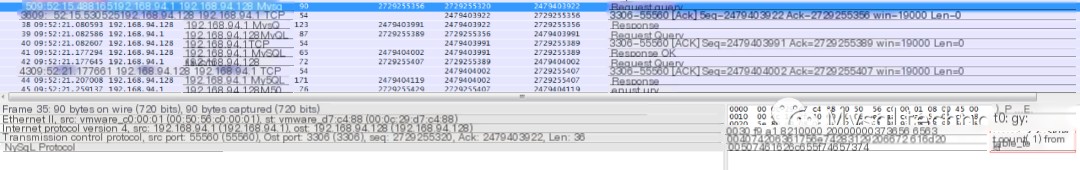
This record shows the application sending a SQL request to the MySQL server on 09:52:15.488165, with the executed SQL seen in the lower right corner: select count(1) from table_test.
Second record:
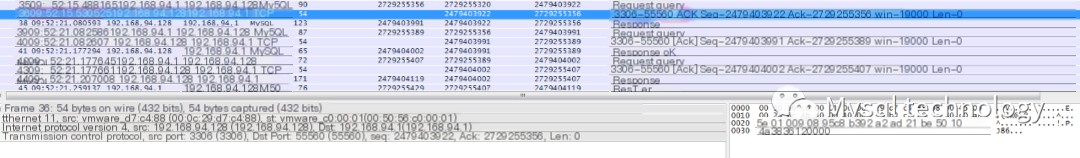
This record indicates the database received the SQL and sent an ACK to the client, acknowledging receipt of the SQL. The sending time was 09:52:15.530525.
The time difference between the second and first records is 42.360ms, meaning it took approximately 42ms for the MySQL server to receive the application’s request.
Third record:
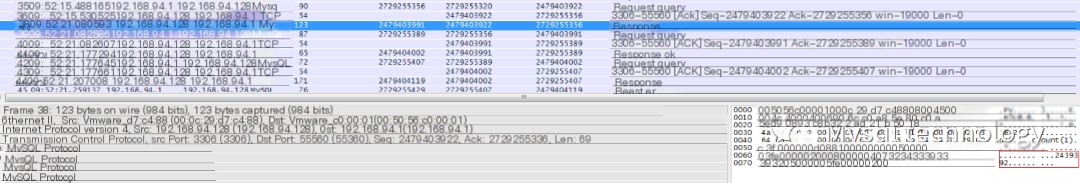
The third record is the database returning the query result to the application, seen as 2439392 in the lower right. The return time was 09:52:21.080593. The time difference between the third and second records is 5.55s, indicating the SQL execution time by the database.
Fourth record:
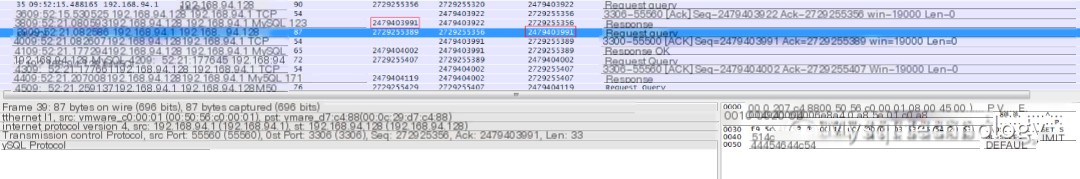
The fourth record shows the application sending an ACK (Sequence 2479403991) to the database server and initiating another request, indicating that the application has received the database query result.
The fourth record’s sending time is 09:52:21.082586, with a time difference of 1.99ms from the third record, representing the time taken for the database to return results to the application.
Through the complete analysis and tracking of the TCP stream, it can be basically determined that the SQL execution process was slow on the database end, with a time taken of approximately 5.6s. Throughout the entire process, there were no packet losses or retransmissions, and no other time-consuming situations occurred, indicating that the network was normal.
These two cases illustrate the importance of tcpdump in a DBA’s actual work. It not only diagnoses network packet loss and delays but also assists DBAs in diagnosing complex database issues.