This morning, I woke up to a message from a friend sent late last night, saying that our association’s website—the Google mirror site—was down. When I checked, it was accessible and seemed fine now. The message was sent at 12:47 AM. Considering the time, there likely weren’t many users, so high traffic shouldn’t have been the cause. Why did it go down? Time to perform some **Nginx log analysis** to investigate.

So, I connected to the server and checked the Nginx log directory.
/var/log/nginx/
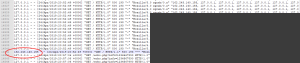
Since the time was relatively early, I directly ran head -n 1000 access.log to check the first 1000 log entries, but found no records??
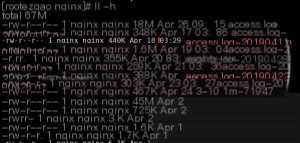
I overlooked two details here, which are also marked in the image.
The first issue was with the time. Nginx compresses the previous day’s logs daily (I installed it via yum), typically around 3 AM. To find logs from after 12 PM, I should have checked the previous day’s logs.
The second issue was with the file format. Notice that the file ends with a .gz extension, not .tar.gz. I made a habitual mistake.
I initially tried tar xvf access.log-20190425.gz, which resulted in an error. Using the file command to check the file gave no indication of an issue.
file access.log-20190425.gz
access.log-20190426.gz: gzip compressed data, from Unix, last modified: Fri Apr 26 03:40:04 2019
This was a single file compressed directly with gzip, not first packaged with tar. The correct way to decompress it was:
gzip -d access.log-20190425.gz
Lesson learned for myself.
After decompressing it correctly, since the file was large, I downloaded it locally to check and locate the specific timestamp. Then…
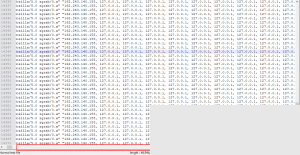
I was dumbfounded. Who on earth did this??
Although Nginx logs remote_addr, all the IPs were from abroad. Could the server have been attacked?
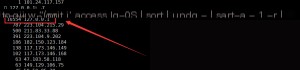
I analyzed the access IPs and found that, apart from 127.0.0.1, the other IPs were normal and familiar. This ruled out the possibility of an attack.
awk ‘{print $1}’ [log file path] | sort | uniq -c | sort -n -k 1 -r | head -n 100
This command is used to count the frequency of IPs in Nginx log files.
Why did 127.0.0.1 appear over 16,000 times? While it’s normal for 127.0.0.1 to show up frequently due to local reverse proxying for port forwarding in Nginx, this number was completely abnormal.
I took a closer look at the log file.
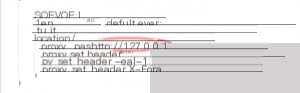
Then it hit me—127.0.0.1 was being logged as x_forwarded_for! And it kept decreasing until it stopped. It was requesting port 80, and I realized something was wrong. I checked my Nginx configuration file. Sure enough, the problem was there.
I was stunned—did I do this to myself?? Am I an idiot??
Previously, when configuring Nginx, I set www.cdtu.site to resolve to port 80. However, I didn’t want others to access anything via port 80, so I configured it to forward requests from port 80 back to the local port 80. Since there was no content on port 80, accessing it directly would result in an error. I thought this was fine and didn’t pay attention to it afterward. It would throw a 500 error but wouldn’t affect other domains, so I ignored it.
Looking back now, this was incredibly foolish. It created an infinite loop: accessing port 80 would forward the request back to local port 80, which would then forward it again to port 80, and so on, until resources were exhausted. The variable $proxy_add_x_forwarded_for recorded the proxy IP, which is why the log file contained so many entries for 127.0.0.1.
As everyone knows, the internet is constantly being scanned, and port 80 is frequently targeted. When there were numerous external requests to my server’s port 80, it effectively caused an internal DDoS attack. Once resources were exhausted, Nginx crashed.
This incident left a deep impression on me. I finally understood the saying: “Developers lay bricks, but sysadmins take the blame!”