I. What are IDS and IPS?
IDS (Intrusion Detection Systems): An intrusion detection system is a network security device or application software that monitors the status of networks and systems based on specific security policies. Its goal is to detect various attack attempts, attack behaviors, or attack outcomes as thoroughly as possible and issue security alerts. Splunk can be integrated with IDS to enhance monitoring and alerting capabilities.
IPS (Intrusion Prevention System): In addition to having the monitoring and detection functions of IDS, an intrusion prevention system can deeply sense and detect data traffic, discard malicious packets to prevent these abnormal or harmful network behaviors.
NSM: Network Security Monitoring system, used to collect, detect, and analyze network security data, typically with IDS as one of its components.
The IPS intrusion prevention system builds on the IDS intrusion detection system by adding event handling and security protection functions, enabling proactive responses to security events.
II. Functions and Classification of IDS/IPS in Splunk
1. IDS can be classified based on two methods: by data source and by intrusion detection strategy.
Classification by data source
- Network-based Intrusion Detection System (NIDS)
- Host-based Intrusion Detection System (HIDS)
- Distributed Intrusion Detection System (DIDS)
Classification by intrusion detection strategy
- Misuse detection
- Anomaly detection
- Integrity analysis
2. IPS consists of the following components based on its functionality:
- Data collection: Collecting and capturing traffic data
- Intrusion detection: Analyzing traffic and log data to detect security anomalies and issue alerts. Common tools include Snort, Suricata, Bro
- Result presentation: Analyzing IDS alerts and displaying them in a user-friendly manner. Common IDS alert analysis tools include Snorby, Sguil, Base, etc.
- Security defense: Proactively responding to security events by taking measures such as discarding packets to prevent abnormal network behavior, e.g., in conjunction with iptables
III. IDS Detection Methods Using Splunk
IDS can be divided into anomaly detection and misuse detection based on the behavior of intrusion detection.
1. Anomaly detection methods
- Statistical anomaly detection methods
- Feature selection anomaly detection methods
- Bayesian inference-based anomaly detection methods
- Bayesian network-based anomaly detection methods
- Pattern prediction-based anomaly detection methods
2. Misuse detection methods
- Conditional probability-based misuse detection methods
- Expert system-based misuse detection methods
- State transition analysis-based misuse detection methods
- Keystroke monitoring-based misuse detection methods
- Model-based misuse detection methods
IV. Building an IDS Intrusion Detection System Based on Suricata+Splunk
Suricata
As more servers upgrade their network cards to 10GB/40GB Ethernet, it becomes increasingly difficult to perform computationally intensive intrusion detection on the line hardware. Suricata is a multi-threaded intrusion detection system that supports both IDS and IPS. Compared to traditional Snort, Suricata’s multi-threaded and modular design makes it more efficient and performant. It distributes CPU-intensive deep packet inspection tasks to multiple concurrent tasks in parallel. This parallel detection can fully utilize the advantages of multi-core hardware to improve the throughput of the intrusion detection system, achieving superior results in deep packet inspection. Additionally, Suricata is compatible with existing Snort rule signatures and adds support for IPv6, gradually becoming a replacement for traditional Snort intrusion detection systems.
| Parameter | Snort | Suricata |
|---|---|---|
| Installation Method | Source code installation, package installation | Source code installation |
| Protocols | TCP, UDP, ICMP, IP | TCP, UDP, ICMP, IP, HTTP, FTP, TLS (SSL), SMB, DNS |
| Rules | Snort rules, EmergingThreats rules | Snort rules, EmergingThreats rules, VRT::Snort rules |
| Threads | Single-threaded | Multi-threaded |
| IPS Support | Implemented in conjunction with iptables, etc. | Supports automatic processing |
| IPv6 Support | Limited support | Full support |
| Packet Capture Method | libpcap | PF_RING, AF_PACKET, netmap, DPDK |
| Help Resources | Official website and extensive online resources | Suricata wiki |
Splunk
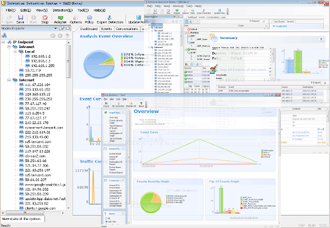
Splunk is a data analysis system. It excels in quickly collecting, searching, analyzing, and obtaining real-time data, with high efficiency and the ability to handle PB-level data. It supports real-time monitoring of data sources and custom filtering rules. Splunk is easy to use, allowing various statistical analysis operations through a user graphical interface and can visually display data in an intuitive manner. In this experiment, Splunk is used to monitor IDS alert log files fast.log in real-time.
1. Installing Suricata
Suricata wiki reference documentation
1. Install Suricata dependencies
  apt-get -y install libpcre3 libpcre3-dbg libpcre3-dev \
build-essential autoconf automake libtool libpcap-dev libnet1-dev \
libyaml-0-2 libyaml-dev zlib1g zlib1g-dev libmagic-dev libcap-ng-dev \
libjansson-dev pkg-config
Install the libhtp library
  git clone https://github.com/OISF/libhtp.git
cd libhtp/
./autogen.sh
./configure
make && sudo make install
2. Download Suricata
Go to the official website to download Suricata and extract it
3. Compile Suricata
By default, Suricata runs in IDS mode. Compile command:
./configure --prefix=/usr --sysconfdir=/etc --localstatedir=/var
If you need Suricata to run both IDS and IPS, install additional dependencies and use the following command to compile
  sudo apt-get -y install libnetfilter-queue-dev libnetfilter-queue1 libnfnetlink-dev libnfnetlink0
./configure --enable-nfqueue --prefix=/usr --sysconfdir=/etc --localstatedir=/var
4. Install Suricata
  make && sudo make install
sudo make install-conf # Install default configuration
sudo make install-rules # Install default rules
sudo ldconfig # Let the system share dynamic link libraries
Configure and Use Suricata to Monitor Security Events
Edit Configuration File
If we use the following command during installation, it will perform default configuration, and we only need to modify the parameters in the relevant configuration files. If you have already used the default configuration, please skip to step 4.
  sudo make install-conf  # Install default configuration
sudo make install-rules # Install default rules
If the default configuration and rules are not installed, we need to configure them manually. Refer to steps 1, 2, 3.
Create Suricata configuration directory and log directory
  sudo mkdir /var/log/suricata
sudo mkdir /etc/suricata
Copy the rule files to the Suricata configuration directory
  wget http://rules.emergingthreats.net/open/suricata/emerging.rules.tar.gz
tar zxvf emerging.rules.tar.gz
sudo cp -R rules/ /etc/suricata/
Copy the suricata.yaml, classification.config, reference.config files from the Suricata source files to the Suricata configuration directory
  cd suricata
sudo cp suricata.yaml classification.config reference.config /etc/suricata/
Edit the configuration file
The Suricata configuration file path is: /etc/suricata/suricata.yaml
sudo vim /etc/suricata/suricata.yaml
We need to pay attention to the following key parameters
HOME_NET : It specifies the local network monitored by Suricata. Modify it according to your network situation
HOME_NET: "[192.168.0.0/16,10.0.0.0/8,172.16.0.0/12]"
The EXTERNAL_NET variable !$HOME_NET represents networks other than the local network.
default-log-dir : The log file storage path, default is /var/log/suricata.
outputs : The outputs option has many output configuration options, including alerts, detected packets, generated results, etc., which can be configured according to your needs.
-
fast.log: The default alert output file. -
unified2.alert: Packet output file, storing the entire packet in binary format. -
http.log: HTTP log, containing HTTP requests, HOST fields, URI fields, and User-Agent fields. -
Syslog: This option determines whether to output Suricata alerts to the syslog file. -
Drop.log: When Suricata is working in IPS mode, the drop operation rules can be used, and the information of the dropped packets will be stored in drop.log
max-pending-packets : Sets the number of packets Suricata can handle simultaneously, with a minimum of 1. The maximum value depends on the size of the memory. Larger memory can set a larger value and have better performance. The default value is 1024.
default-packet-size Suricata configuration documentation
Modify the /etc/suricata/suricata.yaml file to set our test rules file my.rules
  default-rule-path: /etc/suricata/rules
rule-files:
 - my.rules
Then we go to the /etc/suricata/rules directory to create our custom rules file my.rules
In this file, we write our own test rules
  alert icmp $HOME_NET any ->  $EXTERNAL_NET any (msg:"TEST :ICMP PING"; itype:8; sid:20000; rev:3;)
alert tcp any any ->  any 80 (msg:"http test";)
alert http any any ->  any any (msg:"Filemagic jpg(1)"; flow:established; filemagic:"JPEG image data"; filestore; sid:10; rev:1;)
Running Suricata for testing
Suricata has different running modes, we can use the following command to check
sudo suricata --list-runmodes
Before starting Suricata, it is strongly recommended to disable the LRO/GRO features of the network card (i.e., merging small packets into larger ones when receiving packets). This can cause Suricata to easily drop packets and slow down transmission speed. The solution is to disable LRO/GRO features with the command:
  ethtool -k eth0 #Check if LRO/GRO is currently enabled
ethtool -K eth0 lro off #Disable LRO
ethtool -K eth0 gro off #Disable GRO
If you see the following warning message, you can ignore it. It means your network card does not support LRO.
Cannot change large-receive-offload
Then we start Suricata
sudo suricata -c /etc/suricata/suricata.yaml -i eth0
At this point, Suricata will start monitoring our traffic, and if a rule is triggered, it will generate an alert file fast.log in the default log path /var/log/suricata/
Using Suricata to monitor network attacks
Simulating a network attack: MySQL brute force attack
IDS detection rule
alert tcp $EXTERNAL_NET any -> $HOME_NET 3306 (msg:"MySQL Login Attack"; sid:11619; gid:3; rev:6; classtype:attempted-admin; reference:cve,2006-1518; metadata: engine shared, soid 3|11619, service mysql;)
This rule can detect brute force attacks attempting to enumerate MySQL administrator passwords.
Using Splunk to analyze and display IDS alerts
Download Splunk Light
Install web environment: PHP + Apache2
sudo apt-get install php7.0 libapache2-mod-php7.0 apache2
Run the Splunk service
  cd splunk\bin\
./splunk start
Then access the local machine on port 8080. We can dynamically monitor the alert file /var/log/suricata/fast.log