1. Introduction
In the previous article, we introduced the usage of wireshark in detail:
Practical Network Troubleshooting (Part 3) — Detailed Explanation of Wireshark Usage
The most important thing about using wireshark is of course to use it to diagnose network problems.
In this article, we will use wireshark to see how we should deal with these types of network problems.
This article mainly refers to the first 4 sections of Chapter 9 of “Network Analysis Using Wireshark Cookbook”.
2. View TCP connection information through wireshark
You must have already been familiar with the process of TCP connection establishment and communication. You can also refer to this article I wrote before:
Transmission Control Protocol — TCP
2.1 Connection Establishment
As shown in the figure, these three lines are the process of TCP three-way handshake:

First, the client TCP process sends a SYN message with an initial sequence number of 0. In addition, we can also see more detailed information such as MSS and Selective ACK in Wireshark:
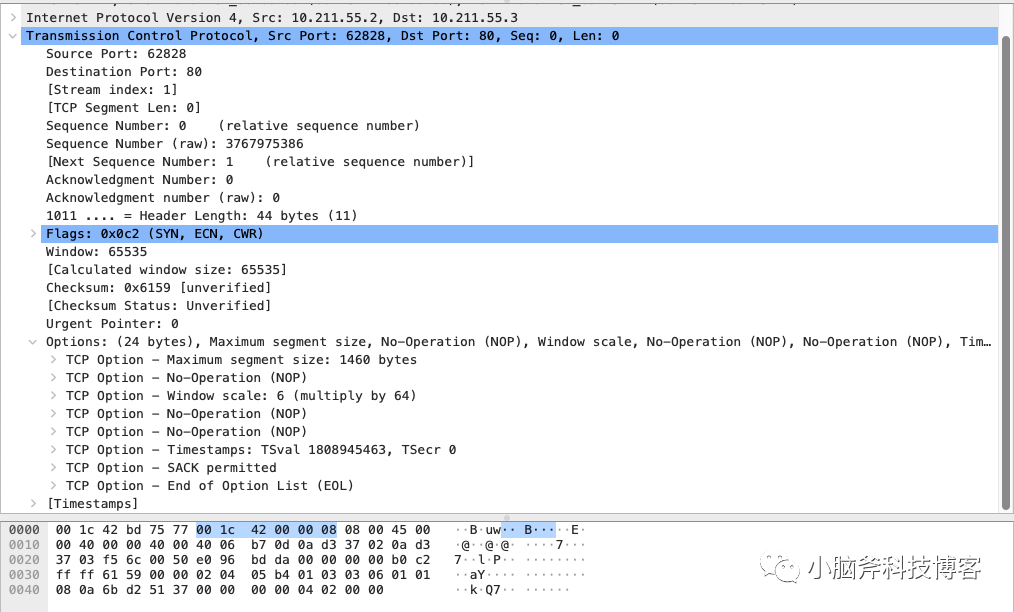
Among these information, you may be more concerned about:
- Maximum Segment Size (MSS) — Maximum message length, the maximum length of a single TCP message.
- Windows Size (WSopt) – Window size.
- SACK — Selective ACK. When retransmission is required, only a single lost message needs to be retransmitted. This feature is enabled only when both ends support it.
- Timestamps options (TSopt) — The delay between the client and the server.
The second line of the message is the server ACKing the client’s SYN message, which also includes the server’s SYN information.
The message contains information such as the server ‘s initial sequence number and the server’s window size.
In addition to the sequence number of the client message, the client window size is again specified in the third line of the client ACK message.
2.2 Troubleshooting
It’s very simple. If you see in the packet capture results that after the client sends a SYN message, the server does not respond or responds with a RST message, then it is obvious that the corresponding port on the server may not be monitored, actively rejected, or blocked by the firewall .
After confirming that the client and server are running normally, you can check the firewall configuration to see if the username and password you passed are correct, as well as the IP and port you want to access are correct.
You may use the ping command to check whether the server is alive, but in many cases, the server will block ICMP messages through the firewall, so you cannot ping the server, but this does not mean that the server has hung up.
3. TCP Retransmission
One of the most common problems in TCP communication is TCP retransmission.
TCP retransmission is an important mechanism used by TCP to recover from damage, loss, duplication or disorder. If the sender does not receive confirmation of the sent packet within a period of time, the sender will trigger a retransmission.
During the communication process, if the TCP retransmission rate reaches 0.5%, it will have a serious impact on performance. If it reaches 5%, the TCP connection will be terminated.
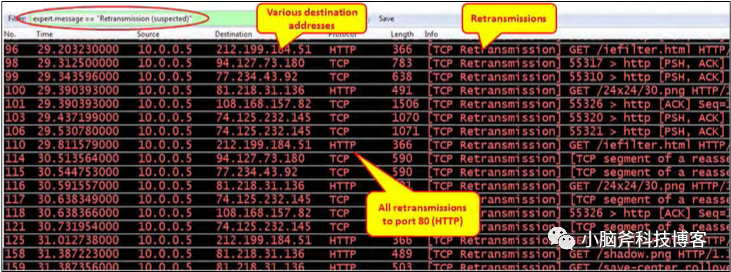
In Wireshark, retransmitted packets are marked as TCP Retransmission.
Get all retransmitted packets in the current packet capture results by configuring the display filter:
expert.message == “Retransmission (suspected)”
As shown in the figure:
3.1 Case 1. Retransmission to multiple destination addresses
As shown in the picture above, you will find that the destination is not centralized but distributed across multiple destination servers. This is usually a link problem, and your network card may be overloaded.
You can turn on Wireshark’s IO load monitoring through the IO Graph option in the Statistics menu of Wireshark, so that you can see whether the communication on the current machine has reached the load bottleneck of the network card.
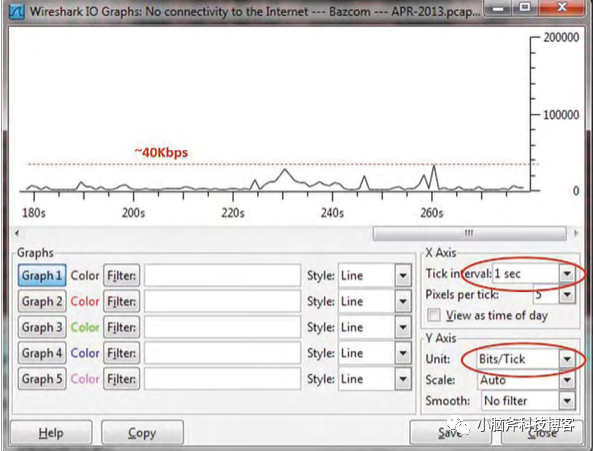
If the network card load is not high as shown in the figure above, it may be because there is a fault in the network card or link or other high-load links that occupy bandwidth.
You can log in to the communication device in the link to view the packet loss rate.
3.2 Case 2. Retransmission only occurs to the same destination address
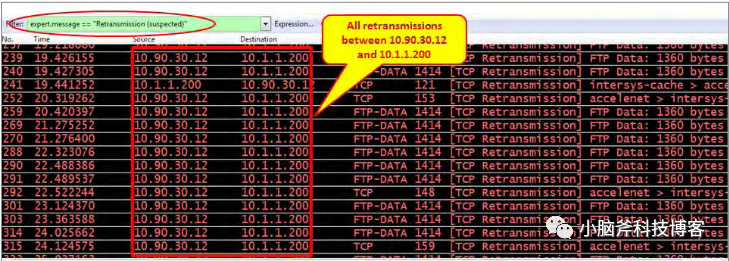
In the above figure, all retransmissions are concentrated on the same destination address, which is usually caused by the low processing performance of the application itself.
To further confirm whether this is the cause, you can follow the steps below:
- As described in the previous section, use the IO Graph provided by Wireshark to check whether the network load is too high.
- Open the network conversation window through the Conversation option of the Statistics menu. Under the IPv4 tab, check the Limit to display filter checkbox to see all conversations where retransmissions have occurred for further confirmation.
- In the network session window, click the TCP tab and select the Limit to display filter checkbox. You can view the specific retransmission port and confirm which application is causing the problem, thereby locating the specific problem.


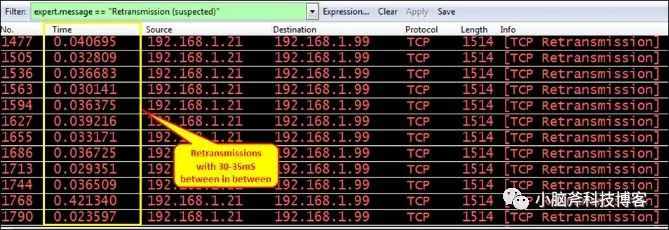
Pay special attention to whether the time of retransmission conforms to a certain periodicity or event triggering. For example, in the figure below, retransmission occurs every 30ms or so, which coincides with the time when the client performs an operation in the software. It is very likely that this operation triggered the occurrence of slow requests.
3.3 Case 3. Application unresponsiveness causes retransmission
If a SYN or ACK packet is sent when establishing a connection and is followed by multiple retransmissions with increasing intervals between retransmissions, this is usually caused by an unresponsive application.

In this case, check the reason why the application is unresponsive. After 15 to 20 seconds, the application may try to reestablish the connection. You can also manually restart the application to reestablish the connection.
3.4 Case 4. Retransmission caused by network jitter
The TCP protocol itself has methods such as Nagle algorithm, sliding window protocol, slow start, congestion avoidance, and fast recovery to avoid network congestion.
However, network jitter has a great impact on the TCP protocol. When the network jitters, TCP retransmission is often triggered.
To confirm this problem, you can ping the destination address and observe the changes in the time value to see if there is any fluctuation.
You can check:
- Whether the link is congested and whether the link status is stable.
- The server where the application is installed has insufficient resources, hardware failure, or low configuration.
- Are there any devices on the network link that are overloaded or have insufficient resources?
4. Conclusion
Generally speaking, the above-mentioned problems can be solved by following the following ideas:
- Summarize: Is the problem associated with a particular host, a particular TCP connection, or a specific behavior?
- Check one by one: whether the link is overloaded, whether there is packet loss on the link, whether there are performance problems on the server or client host, and whether there are performance problems on the application.
- The final question is whether it is caused by network jitter.
My experience is that most performance issues are caused at the business level, that is, by the application code. So the first thing to check is whether the application code has been modified when the performance problem occurs, and whether these modifications will cause these performance problems. After fully denying this situation, you can then spend energy to use tools to capture packets and analyze problems on the network link. Otherwise, it is easy to find that you are going in the wrong direction and trying to catch fish in a tree.
Often, the problem is not caused by network jitter, and while that is the easiest attribution, blaming it on network jitter is often just laziness.


