In certain situations, wire latency may be the cause of slow communications rather than packet loss. Even if communication between two hosts is sluggish, you may not observe common signs like TCP retransmissions or duplicate ACKs. In these cases, alternative techniques are needed to identify the source of the high latency.
One of the most effective ways to find the source of high latency is to examine the initial connection handshake and the first couple of packets that follow it. For example, consider a simple connection between a client and a web server as the client attempts to browse a site hosted on the web server. The portion of this communication sequence we are concerned with is the first six packets, consisting of the TCP handshake, the initial HTTP GET request, the acknowledgment to that GET request, and the first data packet sent from the server to the client.
Normal Communications
We’ll discuss network baselines in detail a little later in the chapter. For now, just know that you need a baseline of normal communications to compare with the conditions of high latency. For these examples, we will use the file latency1.pcap. We have already covered the details of the TCP handshake and HTTP communication, so we won’t review those topics again. In fact, we won’t look at the Packet Details pane at all. All we are really concerned about is the Delta
Time column, as shown in Figure 9-22.
Figure 9-22: This traffic happens very quickly and can be considered normal.
This communication sequence is quite quick. The entire process takes less than 0.1 seconds.
The next few capture files we’ll examine will consist of this same traffic pattern with a few differences in the timing of the packets.
Slow Communications—Wire Latency
Now let’s turn to the capture file latency2.pcap. Notice that all of the packets are the same except for the time values in two of them, as shown in Figure 9-23.
Figure 9-23: Packets 2 and 5 depict high latency
As we begin stepping through these six packets, we encounter our first sign of latency immediately. The initial SYN packet is sent by the client (172.16.16.128) to begin the TCP handshake, and a delay of 0.87 seconds is seen before the return SYN/ACK is received from the server (74.125.95.104). This is our first indicator that we are experiencing wire latency, which is caused by a device between the client and server.
We can make the determination that this is wire latency because of the nature of the types of packets being transmitted. When the server receives a SYN packet, a very minimal amount of processing is required to send a reply, because the workload doesn’t involve any processing above the transport layer. Even when a server is experiencing a very heavy traffic load, it will typically respond to a SYN packet with a SYN/ACK rather quickly. This eliminates the server as the potential cause of the high latency.
The client is also eliminated because, at this point, it is not doing any processing beyond the actual receipt of the SYN/ACK packet.
Elimination of both the client and server points us to potential sources of slow communication within the first two packets of this capture.
Continuing on, we see that the transmission of the ACK packet that completes the three-way handshake occurs quickly, as does the HTTP GET request sent by the client. All of the processing that generates these two packets occurs locally on the client following receipt of the SYN/ACK, so these two packets are expected to be transmitted quickly, as long as the client is not under a heavy processing load.
At packet 5, we see another packet with an incredibly high time value. It appears that after our initial HTTP GET request was sent, the ACK packet returned from the server took 1.15 seconds to be received. Upon receipt of the HTTP GET request, the server first sent a TCP ACK before it began sending data, which once again requires very little processing by the server. This is another sign of wire latency.
Whenever you experience true wire latency, you will almost always see it exhibited in both the SYN/ACK during the initial handshake and in other ACK packets throughout the communication. Although this information doesn’t tell you the exact source of the high latency on this network, it does tell you that neither client nor server is the source, so you know that the latency is due to some device in between. At this point, you could begin examining the various firewalls, routers, and proxies between the affected host to locate the culprit.
Slow Communications—Client Latency
The next latency scenario we’ll examine is contained in the file latency3.pcap, as shown in Figure 9-24.
Figure 9-24: The slow packet in this capture is the initial HTTP GET
This capture begins normally, with the TCP handshake occurring very quickly and without any signs of latency. Everything appears to be fine until packet 4, an HTTP GET request after the handshake has completed. This packet shows a 1.34-second delay from the previously received packet.
We need to examine what is occurring between packets 3 and 4 in order to determine the source of this delay. Packet 3 is the final ACK in the TCP handshake sent from the client to the server, and packet 4 is the GET request sent from the client to the server. The common thread here is that these are both packets sent by the client and are independent of the server. The GET request should occur quickly after the ACK is sent, since all of these actions are centered on the client.
Unfortunately for the end user, the transition from ACK to GET doesn’t happen quickly. The creation and transmission of the GET packet does require processing up to the application layer, and the delay in this processing indicates that the client was unable to perform the action in a timely manner. This means that the client is ultimately responsible for the high latency in the communication.
Slow Communications—Server Latency
The last latency scenario we’ll examine uses the file latency4.pcap, as shown in Figure 9-25. This is an example of server latency.
Figure 9-25: High latency isn’t exhibited until the last packet of this capture.
In this capture, the TCP handshake process between these two hosts completes flawlessly and quickly, so things begin well. The next couple of packets bring more good news, as the initial GET request and response ACK packets are delivered quickly as well. It is not until the last packet in this file that we see a packet exhibiting signs of high latency.
This sixth packet is the first HTTP data packet sent from the server in response to the GET request sent by the client, but with a rather slow arrival time of 0.98 seconds after the server sends its TCP ACK for the GET request. The transition between packets 5 and 6 is very similar to the transition we saw in the previous scenario between the handshake ACK and GET request. However, in this case, the server is the focus of our concern
Packet 5 is the ACK that the server sends in response to the GET request it received from the client. As soon as that packet has been sent, the server should begin sending data almost immediately. The accessing, packaging, and
transmitting of the data in this packet is done by the HTTP protocol, and because this is an application layer protocol, a bit of processing is required by the server. The delay in receipt of this packet indicates that the server was unable to process this data in a reasonable amount of time, ultimately pointing to it as the source of latency in this capture file.
Latency Locating Framework
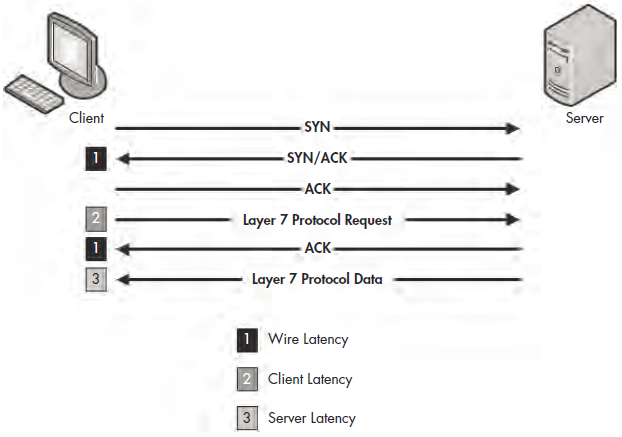
Using six packets, we’ve managed to locate the source of high network latency from the client and the server. These scenarios may seem a bit complex, but the diagram shown in Figure 9-26 should make the process a bit quicker when
troubleshooting your own latency issues. These principles can be applied to almost any TCP-based communication.
TIPS Notice that we have not talked a lot about UDP latency. Because UDP is designed to be quick but unreliable, it doesn’t have any built-in features to detect and recover from latency. Instead, it relies on the application layer protocols (and ICMP) that it’s paired with to handle data delivery reliability.
Figure 9-26: This diagram can be used to troubleshoot your own latency issues.


