Malicious DNS Request Investigation in a Single Node Scenario
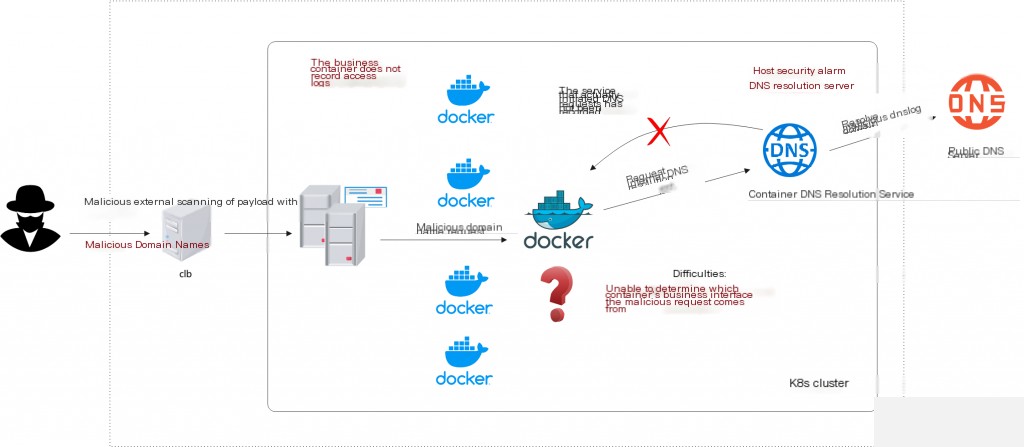
In a k8s cluster, a host requests a malicious domain, triggering a host security alert. However, the investigation reveals that the alerted host is responsible for the cluster’s DNS resolution, while the actual malicious request is initiated by another host/container. How can we quickly identify the vulnerable service or application in such scenarios?
How to respond to emergencies in k8s scenarios?
Malicious DNS Request Investigation in k8s Scenarios
k8s uses CoreDNS or kube-dns for internal DNS resolution within the cluster. Investigating malicious requests in such cloud-native scenarios can be relatively cumbersome. All services are containerized, and DNS services in k8s do not log by default.
Approach One: Enable CoreDNS Query Logging
Locate the container running CoreDNS.
kubectl get pods -A -o wide | grep dns
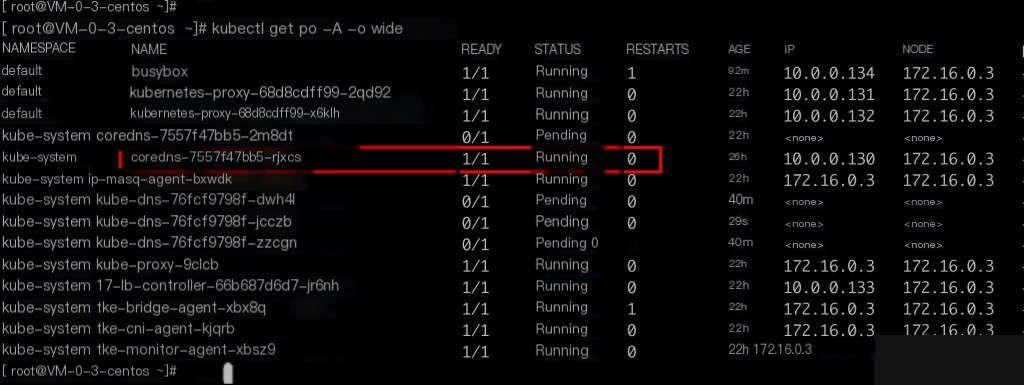
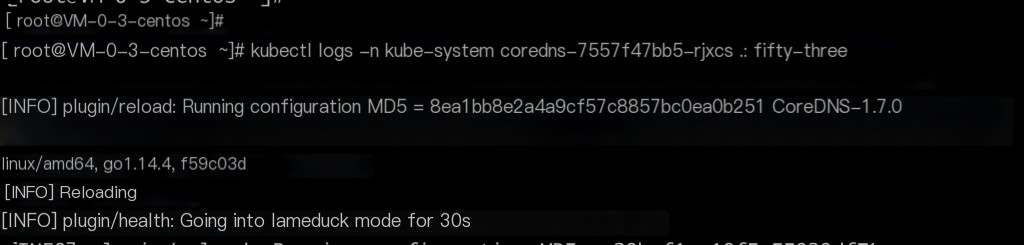
By default, CoreDNS does not log queries. Executing the logs command will not show any query records. Note: Include the -n kube-system (namespace) flag when executing commands.
Modify the CoreDNS configuration file to include logging.
kubectl edit configmap coredns -n kube-system
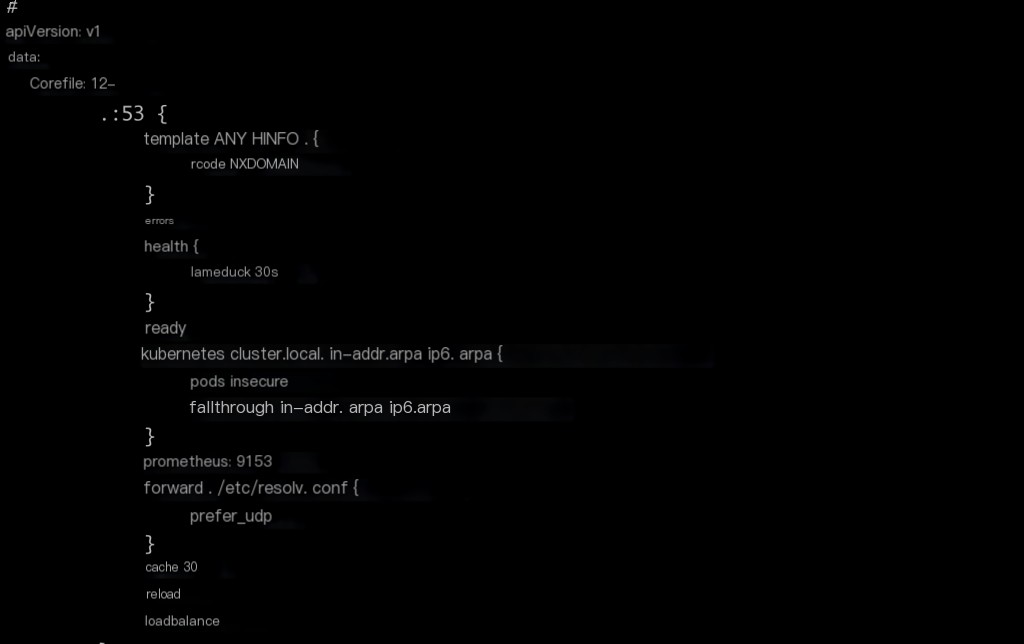
Default CoreDNS configuration
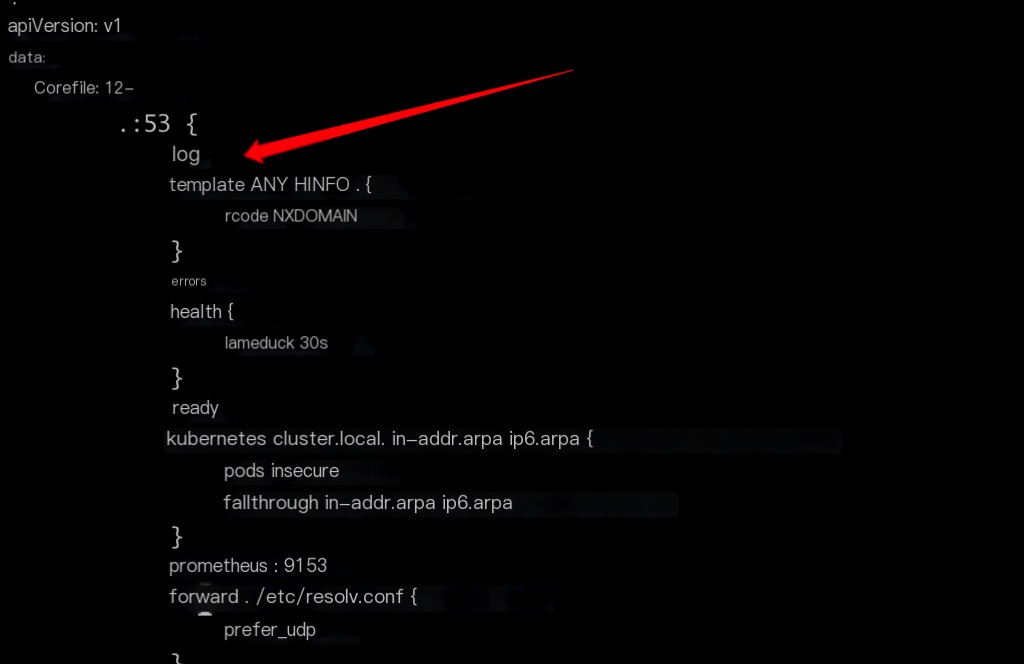
Add logging; without this configuration, default rules apply.
Modifying the CoreDNS configuration will automatically restart it.
Be aware of the potential impacts of enabling logging:
- Restarting CoreDNS may temporarily affect cluster domain name resolution.
- High query volume may impact service performance when logging is enabled.
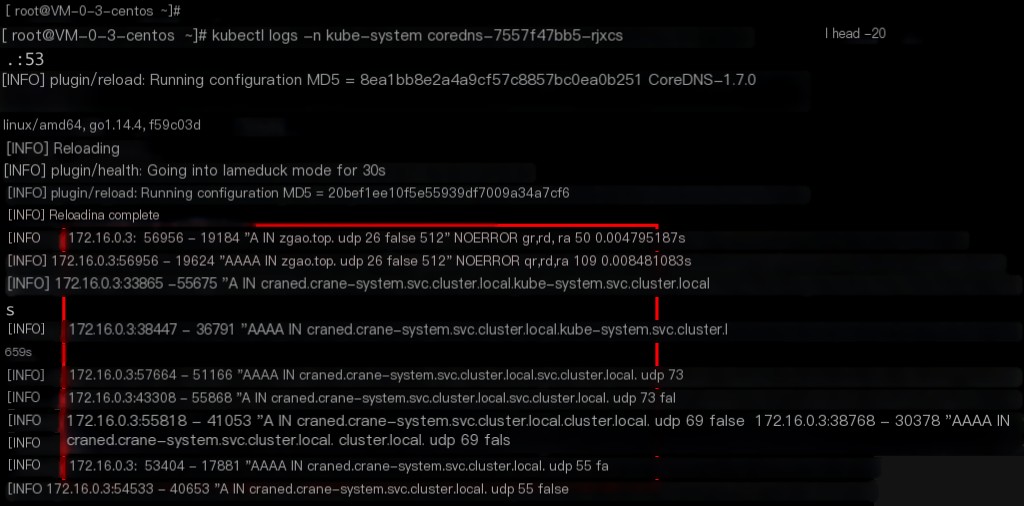
Test which pod the DNS query originates from?
After enabling logging, use another container to initiate a DNS request. You can see the corresponding container IP.
Approach Two: Capture Packets with tcpdump
Capture traffic on port 53 on the host running CoreDNS. However, you need to correlate the malicious request alert with the exact time of the packet information.
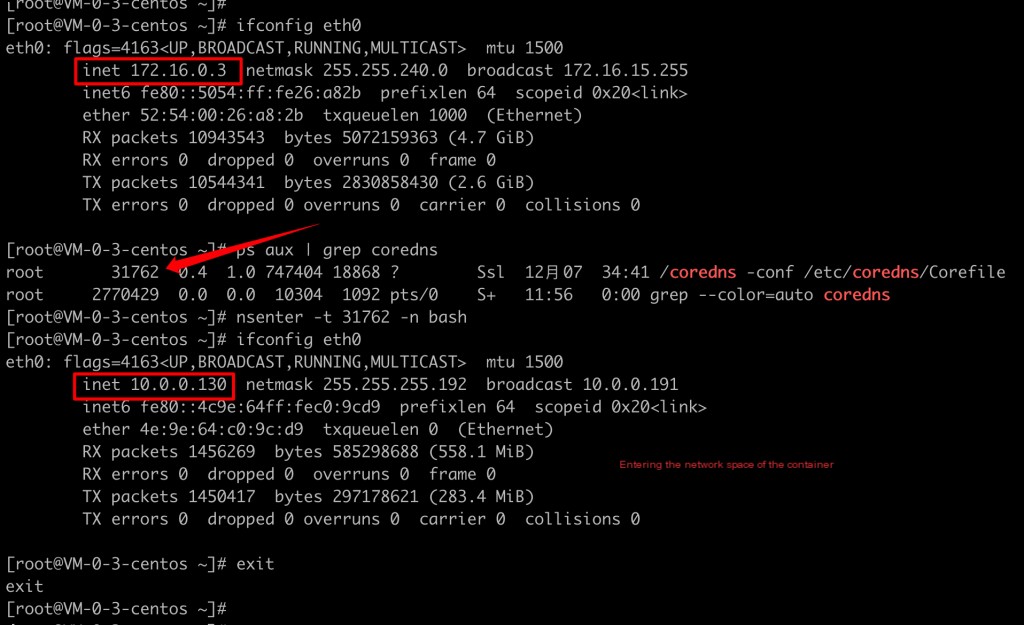
In k8s scenarios, many commands are unavailable within containers. In this case, use nsenter to enter the container’s network namespace for packet capture. A typical use case is entering the container’s network namespace. Containers usually lack basic network management and debugging tools like ip, ping, telnet, ss, tcpdump, etc., which makes network debugging within containers quite challenging.
nsenter Installation
nsenter is part of the util-linux package, which is typically pre-installed on most common Linux distributions. If your system does not have it installed, use the following command:
yum install util-linux -y
nsenter Enter the Container Network Namespace
nsenter -t -n bash
tcpdump -i any port 53 -C 20 -W 200 -w /tmp/client_dns.pcap
Under normal circumstances, packet capture does not affect business operations, only slightly increasing CPU load and disk writes. This command rotates the captured packets, writing up to 200 files of 20 MB each.
However, the above command outputs the packet content to a file, making it impossible to see the records on standard output. If you do not need the full packet data, use the following command:
tcpdump -i any port 53 -vvv | tee -a /tmp/dns.log
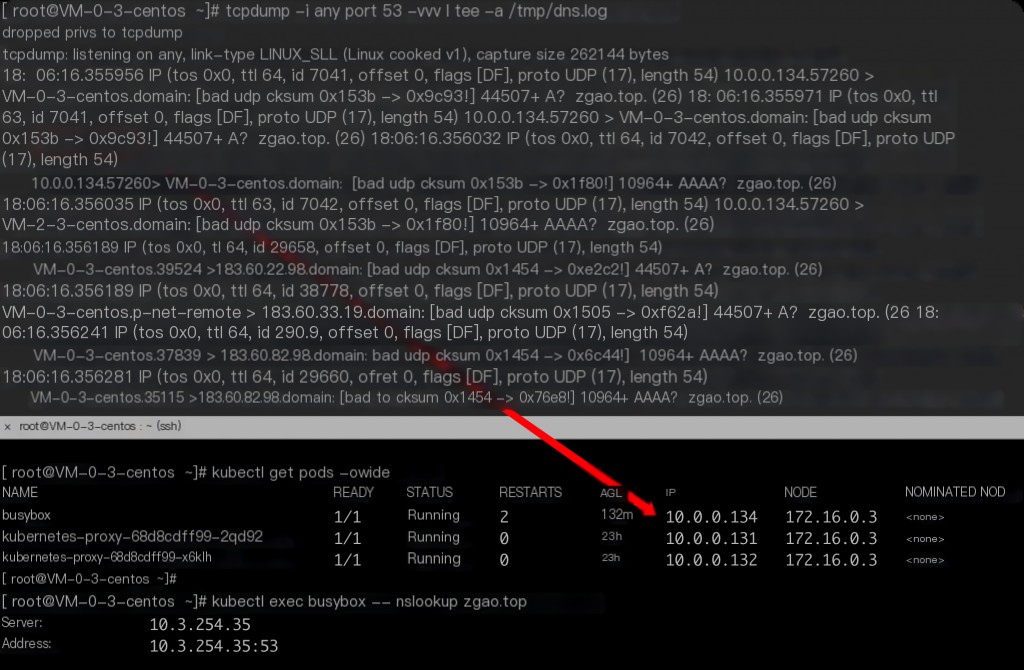
This also captures the IP addresses of DNS requests within CoreDNS.