

How to Analyze Which Process on a Server Has the Most Traffic? I suppose many people have similar needs. There is a community-made nethogs tool written in C that conveniently provides a list of the TOP N processes with high traffic.
Since there’s already a tool called nethogs, why implement it in Go using go-netflow? Primarily because nethogs lacks flexibility and doesn’t offer interfaces for other programs to use. We now need such interfaces. While not every company has this requirement, people typically analyze abnormal traffic when it occurs.
Code Improvements in Network Traffic Analysis with go-netflow
The project is named go-netflow, and the code has been submitted to GitHub.
The address is https://github.com/rfyiamcool/go-netflow. Those interested can take a look, and don’t forget to star it.
From design to traffic testing completion, it took roughly two and a half days. The interface of go-netflow is relatively complete and at least meets the needs of our container cloud team and SREs. However, its CLI terminal part is quite rudimentary. Those interested can help by submitting a PR.
Implementation
Open-source monitoring software like Prometheus and OpenFalcon obtain connection and traffic information through /proc/net/snmp and /proc/net/netstat.
- The
/proc/net/snmpfile only provides detailed data on the host’s IP, ICMP, ICMPMsg, TCP, UDP layers. - The
/proc/net/netstatfile provides the number of packets sent/received and bytes received by the host.
These two files only show host-level information, and it’s impossible to achieve process-level traffic collection.
However, we can accomplish fine-grained, process-level traffic monitoring through other means. 😁
Through /proc/net/tcp and /proc/net/udp files, we can obtain TCP and UDP tuples along with inode information. Through /proc/{pid}/fd/, we can obtain the mapping relationship between PID and socket inode file descriptors.
So where can we get the traffic? By packet capturing, similar to tcpdump using pcap for packet capturing.
Here’s a detailed discussion on the implementation of process traffic statistics based on pcap.
- During the startup phase, scan
/proc/net/tcpand/proc/{pid}/fd/{socket inode}. Build three cache hashmaps:- connInodesMap, which defines the correspondence between TCP connections and inode numbers.
- inodePidMap, which defines the correspondence between inode and process PID numbers.
- processMap, which stores basic information about processes, along with a cache and statistics of recent 15-second traffic.
- Use the GOPacket library package from Google for packet capturing. Send the captured data to a channel. If the queue is full, discard directly, which can be understood as sampling. This channel can be consumed by multiple goroutines, but we recommend only one consumer.
- Retrieve packet structure objects from the channel, extract and parse them into IPLayer and TCPLayer. Obtain the source and destination IP addresses from the IPLayer, and fetch the source and destination port numbers from the TCPLayer.
- From
address:source port_destination address:destination port, get the inode index number from connInodeMap. Then obtain the PID from inodePidMap and the process object from processMap, finally performing cumulative calculations of inbound and outbound traffic.
The above describes the normal flow. If new connections and processes are created during traffic capture with pcap, inode or PID information may not be available. Therefore, regularly re-scanning those metadata files and performing incremental operations on these cache maps is necessary. Place packets of unresolved processes into a ring buffer cache. After each periodic scan of /proc metadata, attempt to compute cached items in the ring buffer.
Points to Note:
You can’t monitor those metadata files in /proc using inotify. They can only be periodically scanned or passively updated using notifications. The same logic applies to UDP, so I won’t repeat it.
How to Determine Inbound or Outbound Traffic?
If src.ip is the local IP address, it is outbound traffic. If src.ip is not the local IP address, it is definitely inbound traffic. Go-netflow needs to get the local IP address list at startup.
How to Monitor Multiple Network Interfaces
Google’s GoPacket library by default can only openlive one network interface. I found no way to openlive multiple device interfaces. When we capture packets with tcpdump, we can match multiple interfaces using -i any. So how to achieve monitoring multiple device interfaces in GoPacket? Just instantiate multiple openlive instances, which I somehow asked as an issue. Unsurprisingly, nobody replied to me.
How to Limit CPU/Mem Resources
TCPdump at a high-traffic gateway consumes significant CPU resources. In netflow, some simple limitations are applied: not processing all packets synchronously but throwing them into the queue for asynchronous processing. If the queue is full, discard directly. Limit the number of processed packets using simple atomic counters.
However, unexpected situations may cause significant CPU resource consumption. How to limit CPU resources?
Here, directly use Linux cgroups to limit CPU and memory resources. When creating a new netflow object, cgroup parameters can be passed. The CPU is the number of cores and can be 0.5, meaning it occupies only 50% of one CPU core. Mem is the limited memory amount, measured in MB, defaulting to 0, meaning no restriction.
WithLimitCgroup(cpu float64, mem int)Write to Pcap File
Netflow supports writing to pcap files, which can be later read through tcpdump or Wireshark.
Timeout Mechanism
Netflow has a default timeout of 5 minutes. After exceeding 5 minutes, it will close all devices. This is mainly to avoid forgetting to close long-running operations, especially those capturing packets through the netflow interface.
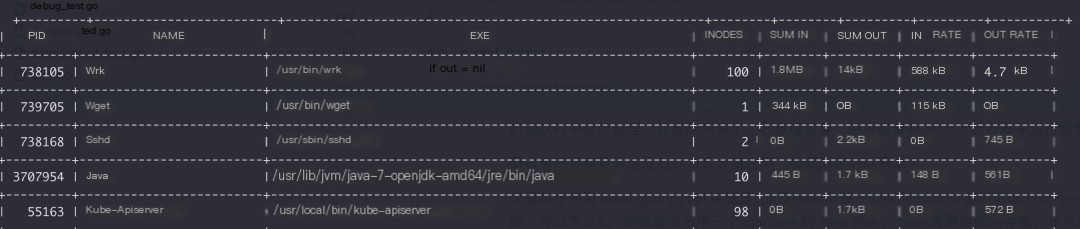
Effect
Optimization
There is still room for optimization in go-netflow. In terms of memory, some objects can be reused using sync.pool to reduce the creation of new objects. CPU overhead mainly lies in the calls to Google’s GOPacket, and calling cgo is not cheap, with no good optimization method at the moment. Additionally, the traffic monitoring for processes does not need to be very detailed; coarse-grained sampling is sufficient.