Due to the need for code auditing, some systems are directly deployed as server images with fully configured environments. In such cases, pulling the source code to a local machine and configuring the environment separately can be overly complex. Remote development and debugging of the server-side code directly becomes much more convenient.
The latest version of Phpstorm (2022.1.4) and most of JetBrains’ current IDEs now support SSH connections to servers for remote development. There’s no need to use SFTP to sync code as before. The IDE can now achieve automatic real-time synchronization, providing true remote development. Therefore, the configuration tutorial differs slightly from previous online guides.
Experimental Environment
- Local system: macOS
- Server system: CentOS 7
- Phpstorm / Xdebug
Remote Development: SSH Connection to Remote Server
Install the latest Phpstorm, select Remote Development, and fill in the SSH connection information. The first connection will install the IDE program on the server. Then choose the directory where the server-side program is deployed. At this point, you can start writing code remotely, and the IDE will automatically synchronize.
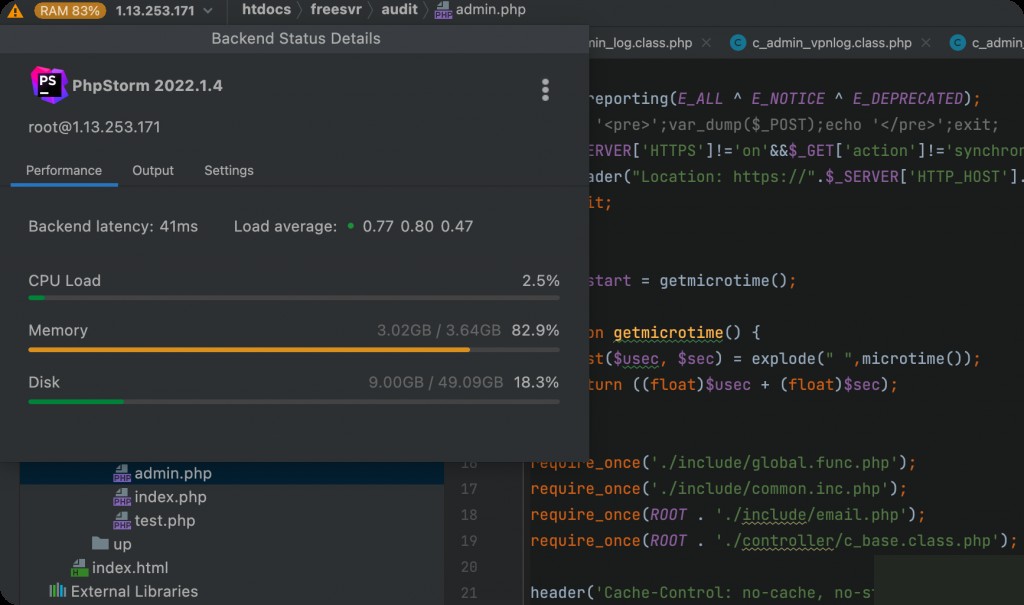
After entering the main interface, the current server load information will be displayed in the upper left corner. Remote development can be resource-intensive for the server, so it is recommended to use a machine with at least 2 cores and 4GB of RAM.
Installing Xdebug on the Server
Determine the Current PHP Version
The goal here is to audit the PHP code in the system image. First, determine the PHP version and installation location of the system.
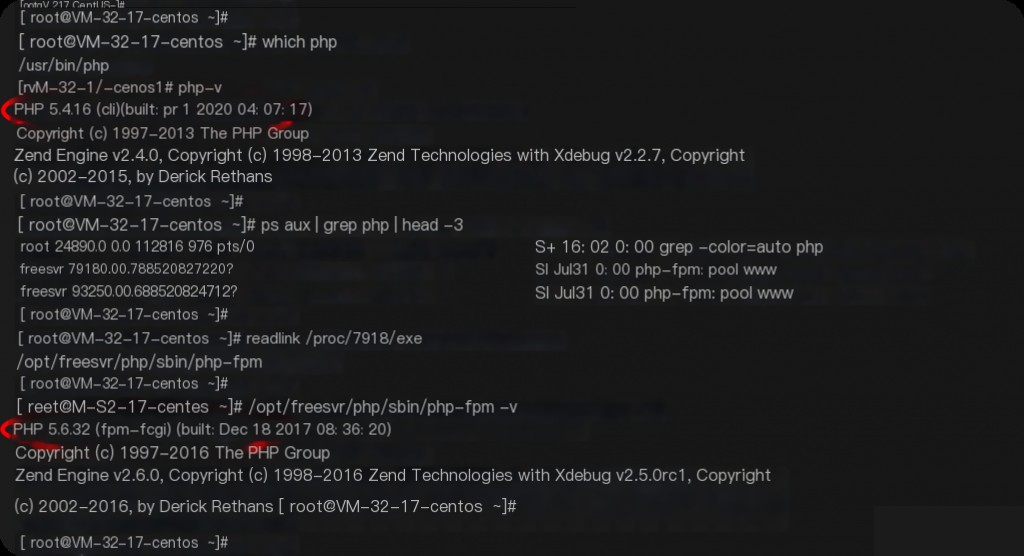
For example, in my case, the PHP version in the system image and the actual running PHP are not the same. The running PHP has not been added to the system environment variables.
Download and Install the Corresponding Xdebug Version
Xdebug download link:
https://xdebug.org/download/historical
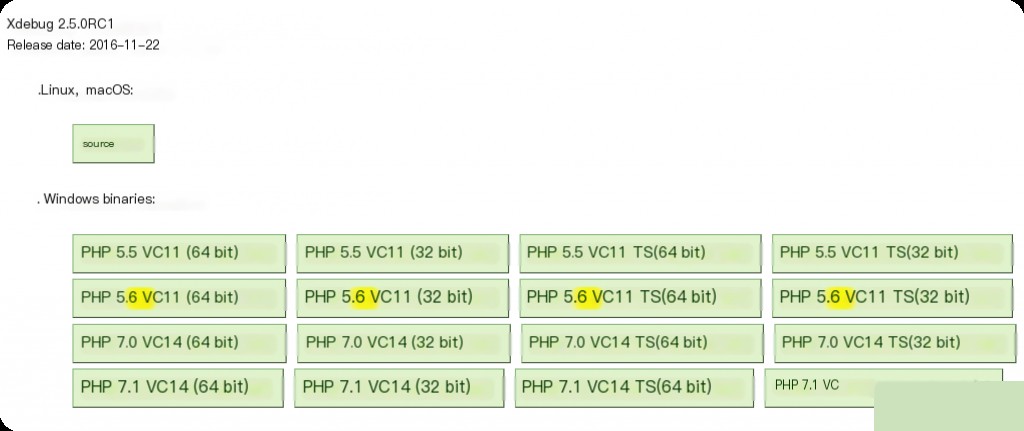
The current server’s PHP version is 5.6.32, so download version 2.5.0RC1 from the official site. If the PHP and Xdebug versions do not match, you may need to download and try several versions.
 wget https://xdebug.org/files/xdebug-2.5.0rc1.tgz --no-check-certificate
tar xvf xdebug-2.5.0rc1.tgz
cd xdebug-2.5.0RC1/
/opt/freesvr/php/bin/phpize      # Execute the corresponding phpize
./configure --with-php-config=/opt/freesvr/php/bin/php-config
make && make install
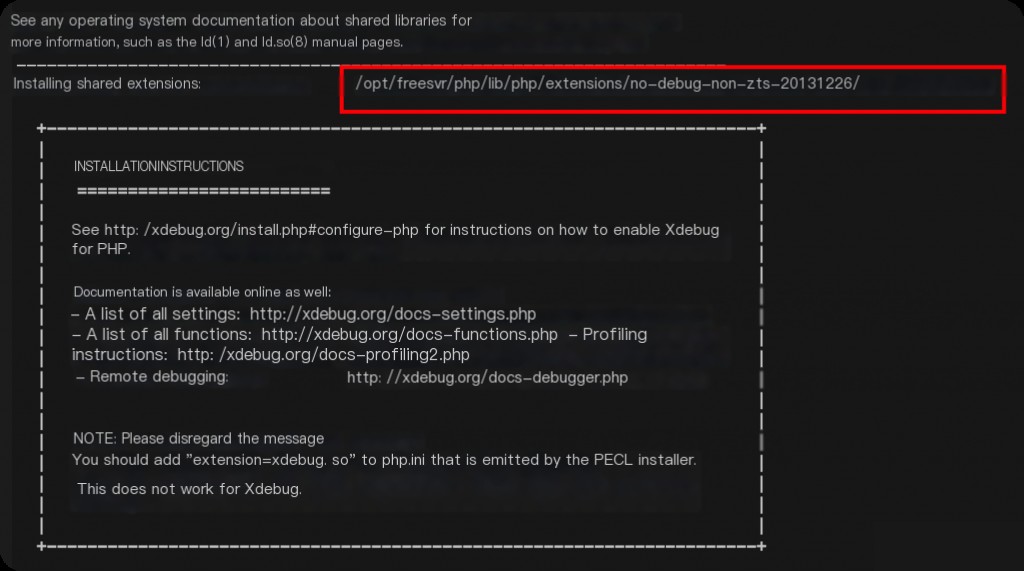
After installation, the following screen will appear, showing the path to the xdebug.so file.
Modify php.ini and Restart php-fpm
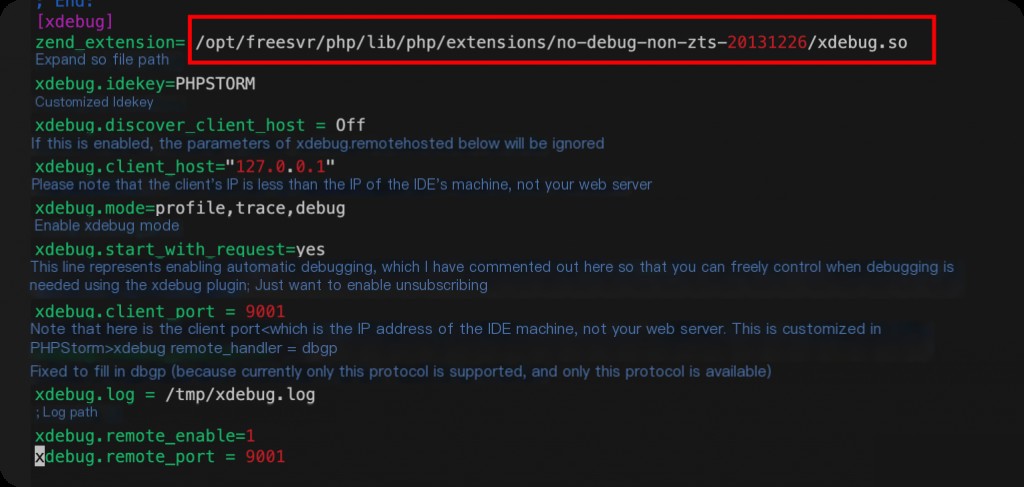
Modify the php.ini configuration file and add the following Xdebug configuration information.
 [xdebug]
zend_extension= /opt/freesvr/php/lib/php/extensions/no-debug-non-zts-20131226/xdebug.so
; Path to the extension .so file
xdebug.idekey=PHPSTORM
; Custom idekey
xdebug.discover_client_host = Off
; If enabled, it will ignore the xdebug.remote_host parameter below
xdebug.client_host="127.0.0.1"
; Note that this is the client's IP (i.e., the IP of the IDE machine, not your web server)
xdebug.mode=profile,trace,debug
; Enable Xdebug modes
xdebug.start_with_request=yes
xdebug.client_port = 9001
; Note that this is the client's port (i.e., the port of the IDE machine, not your web server, this is customized in Phpstorm)
xdebug.remote_handler = dbgp
; Always set to dbgp (as currently only this protocol is supported)
xdebug.log = /tmp/xdebug.log
; Log path
xdebug.remote_enable=1
xdebug.remote_port = 9001
Specifying port 9001 avoids conflicts with the default php-fpm port 9000.
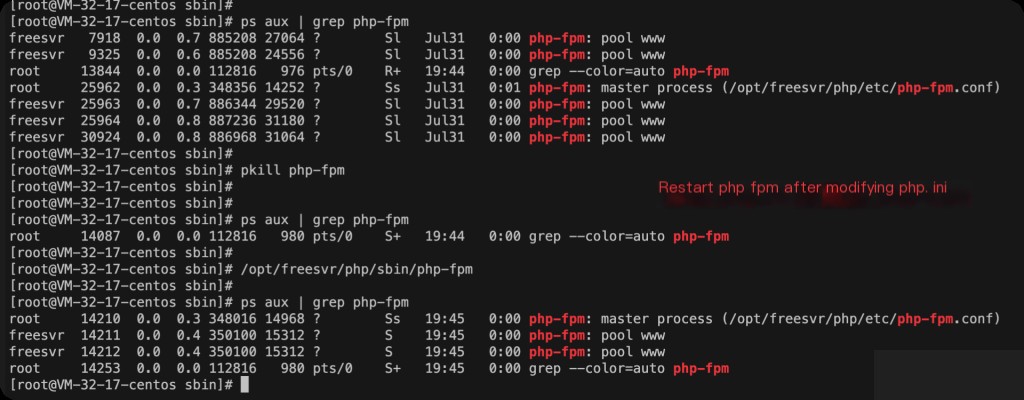
 ps aux | grep php-fpm
pkill php-fpm
/opt/freesvr/php/sbin/php-fpm
PHP 5.3.3 and later versions of php-fpm no longer support the (start|stop|reload) commands, so directly pkill and restart.
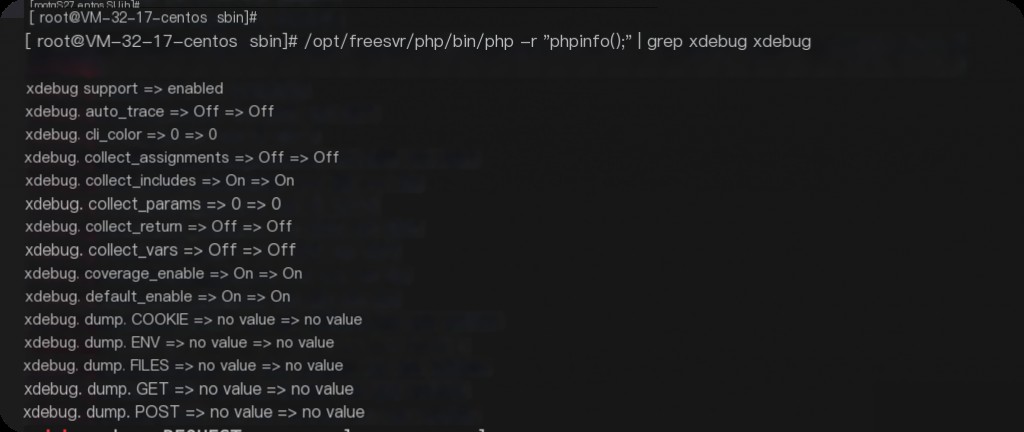
/opt/freesvr/php/bin/php -r "phpinfo();" | grep xdebug
You can also open the phpinfo page in a web browser.
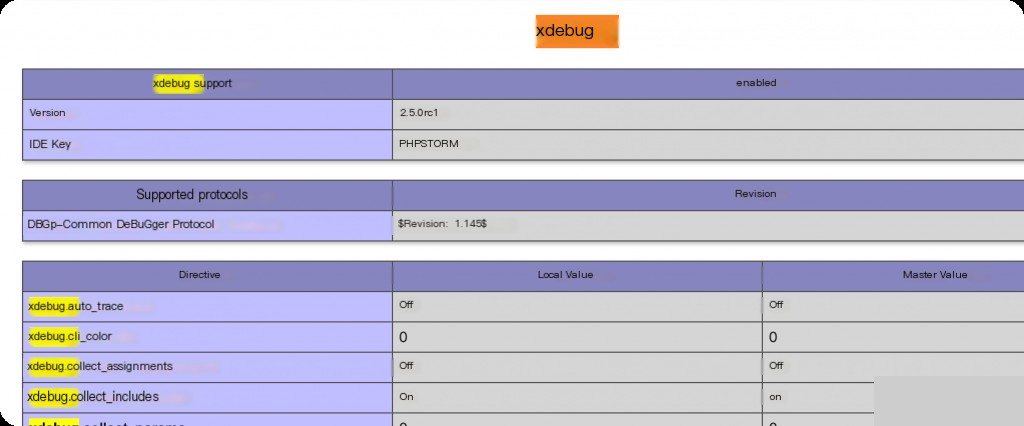
After restarting, if you see Xdebug information in phpinfo(), it means Xdebug has been successfully enabled.
Phpstorm Client Configuration
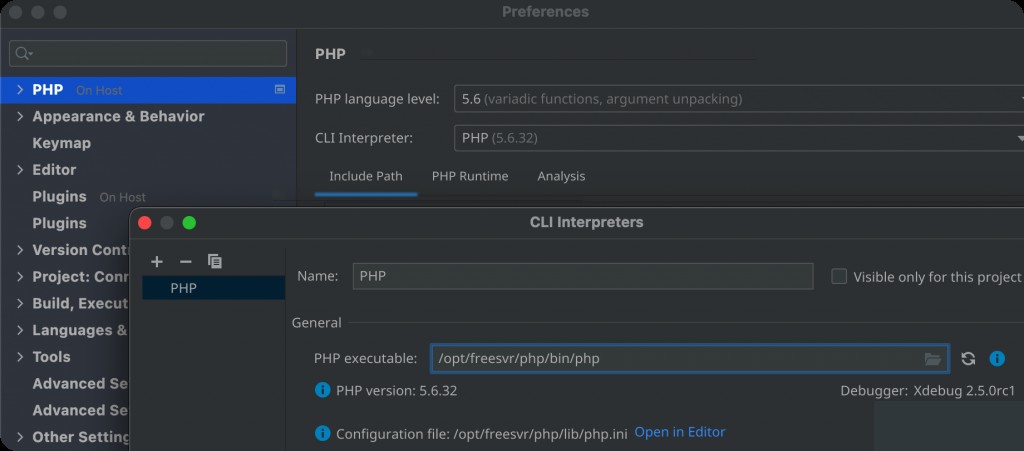
Specify PHP Interpreter Path
In the settings, choose the server’s PHP path.
Configure Xdebug
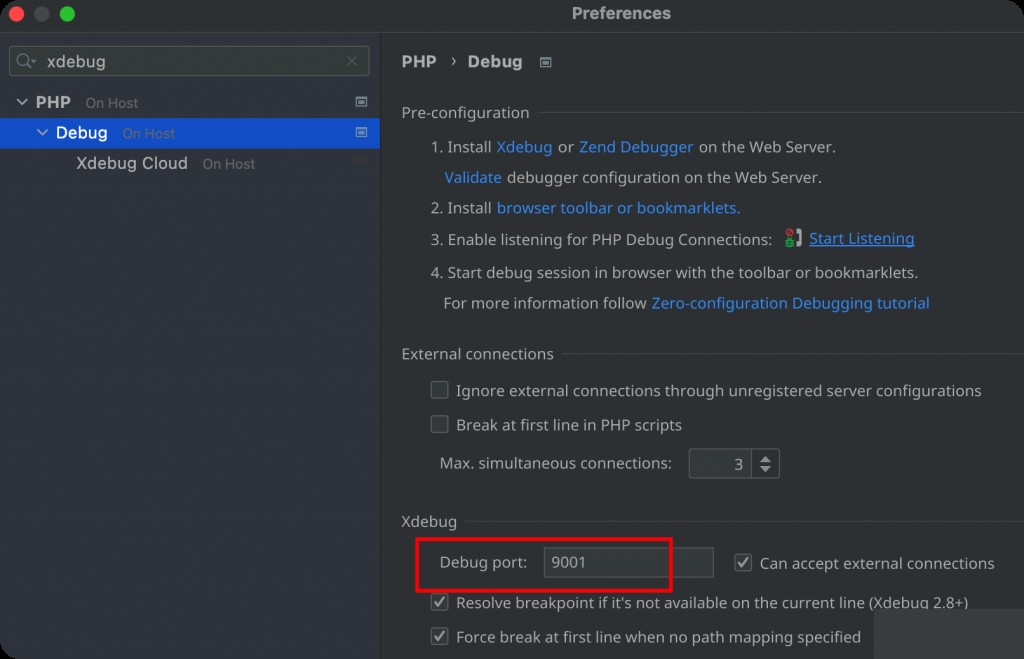
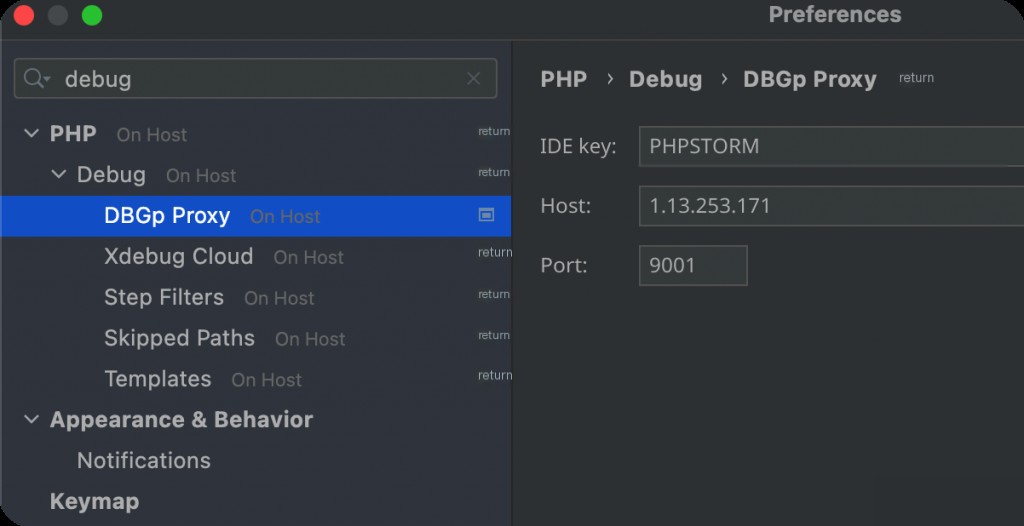
Ensure the port matches the one specified in the php.ini Xdebug configuration. Then configure DBGp Proxy.
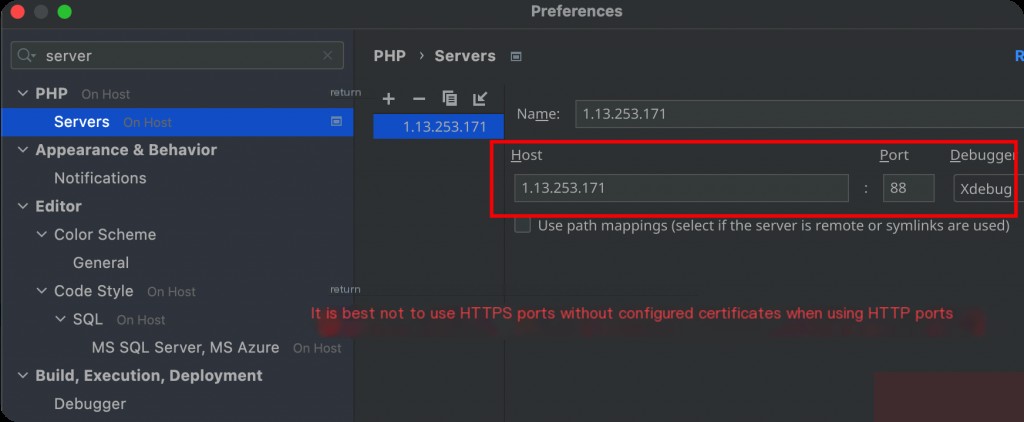
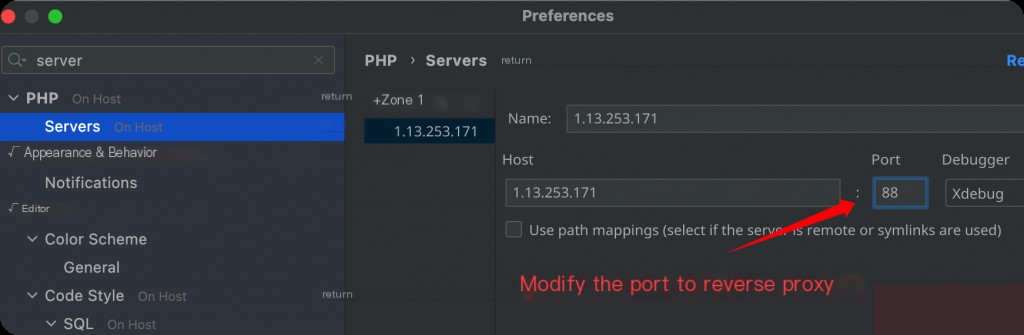
Configure Server Web Port
Troubleshooting
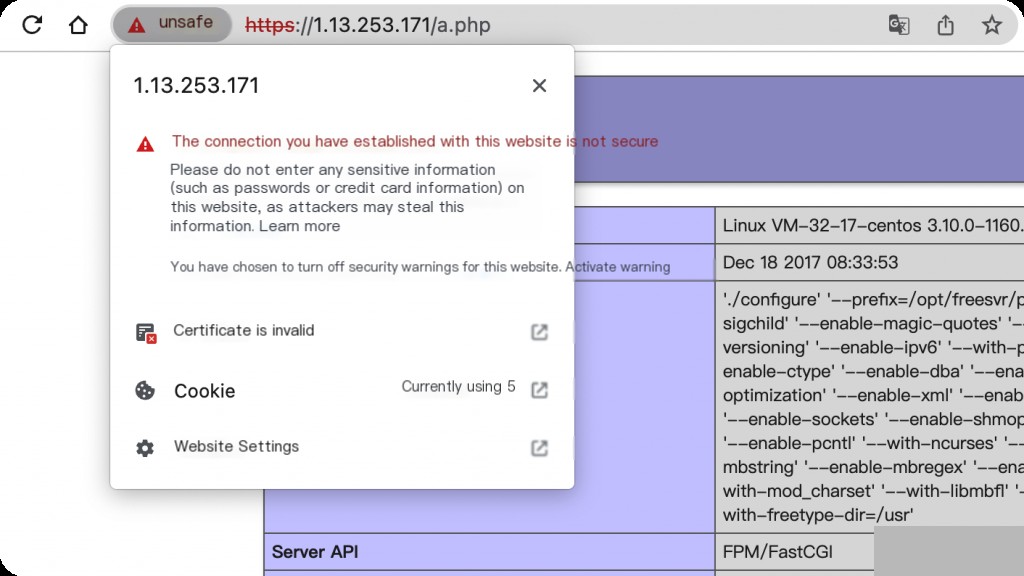
Since the system image uses port 443 by default, but the certificate is expired, accessing it directly will result in an error.
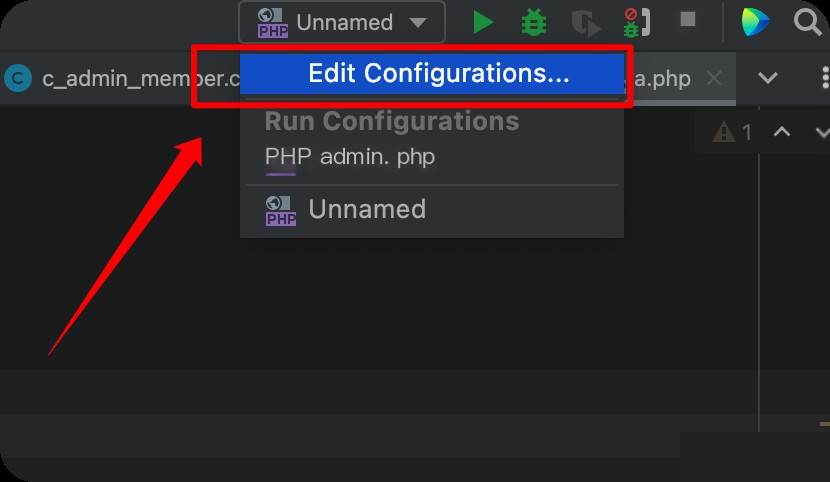
Click the edit button in the upper right corner.
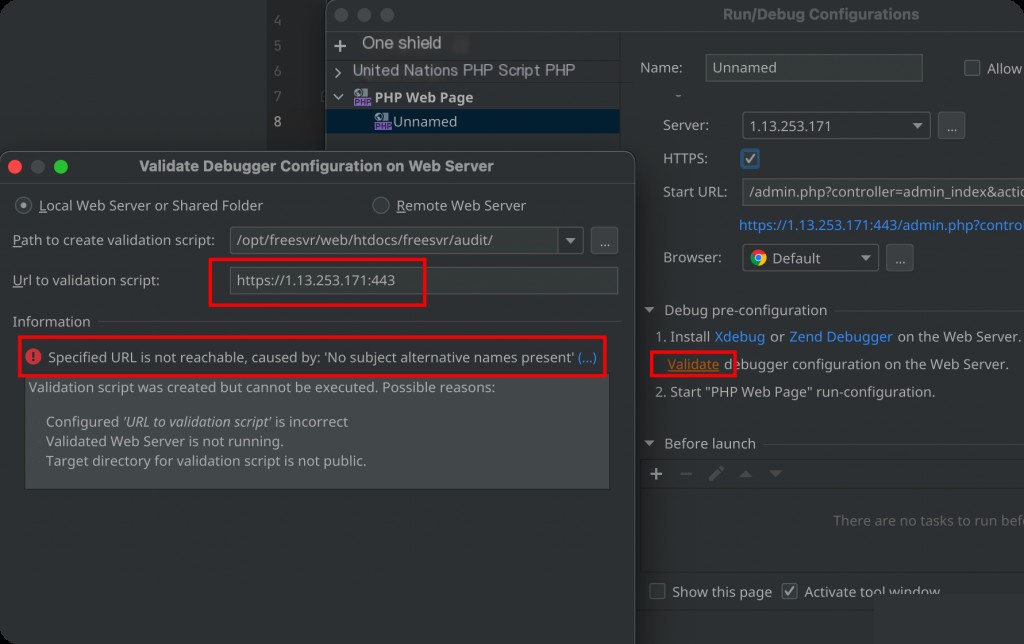
PhpStorm error message: specified URL is not reachable, no subject alternative names present.
This is due to the expired HTTPS certificate, which caused a long delay.
Eventually, I thought of a workaround. Since the image is configured to access Nginx on port 443 by default, I can configure a local reverse proxy on the server to solve the problem.
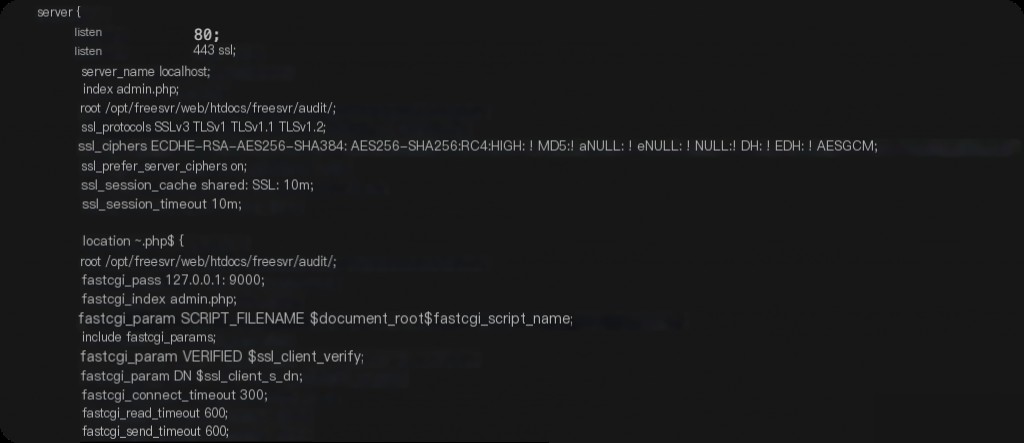 Default Nginx configuration, SSL certificate is expired
         server {
                listen 88;
                location / {
                proxy_pass https://127.0.0.1:443;
                proxy_ssl_verify off;
        }
Adding a layer of reverse proxy solves the SSL certificate error issue.
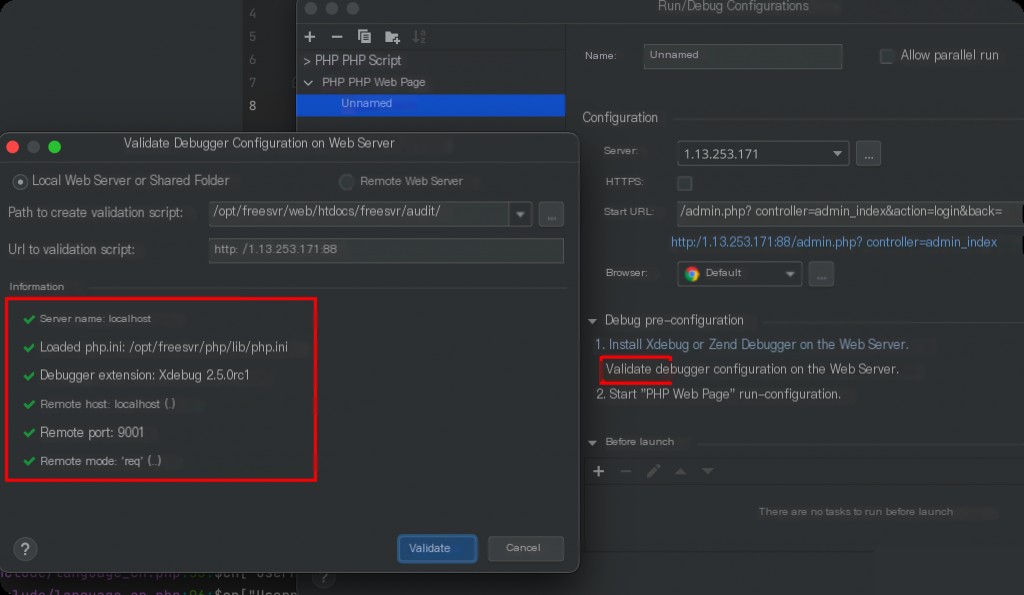 Verification successful
Install Xdebug Helper Browser Plugin
https://chrome.google.com/webstore/detail/xdebug-helper/eadndfjplgieldjbigjakmdgkmoaaaoc
After installation, select Phpstorm in the plugin configuration page.
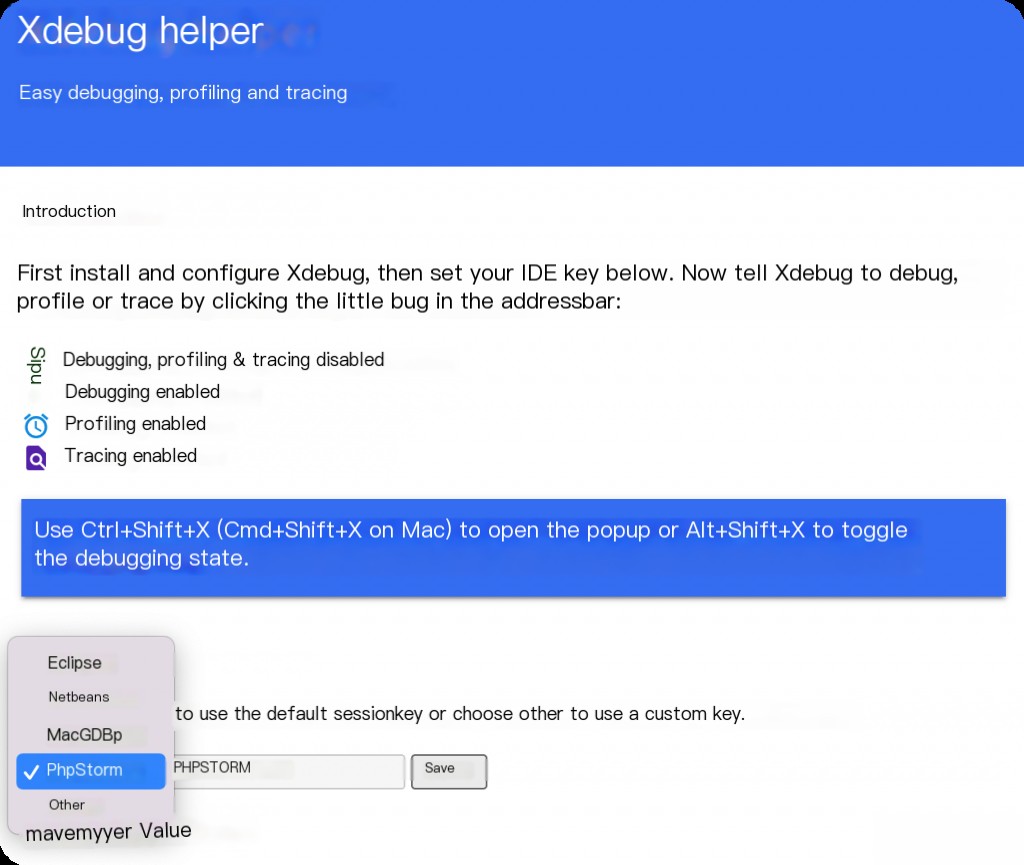
Go back to the website and enable debugging.
Start Debugging Remote Code
Then click the small phone icon in the upper right corner. The IDE will listen on port 9001 on the server. In older versions of Phpstorm, you needed to configure local SSH remote port forwarding, but the IDE now handles this automatically.
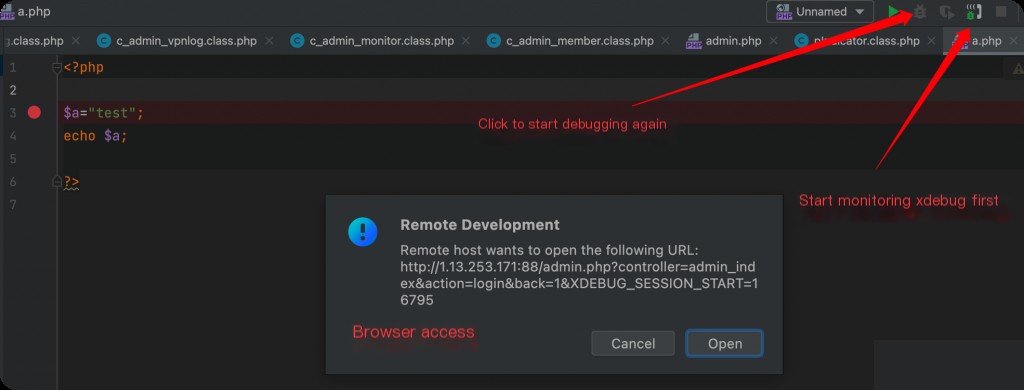
When the browser accesses this page, the IDE will automatically break here.
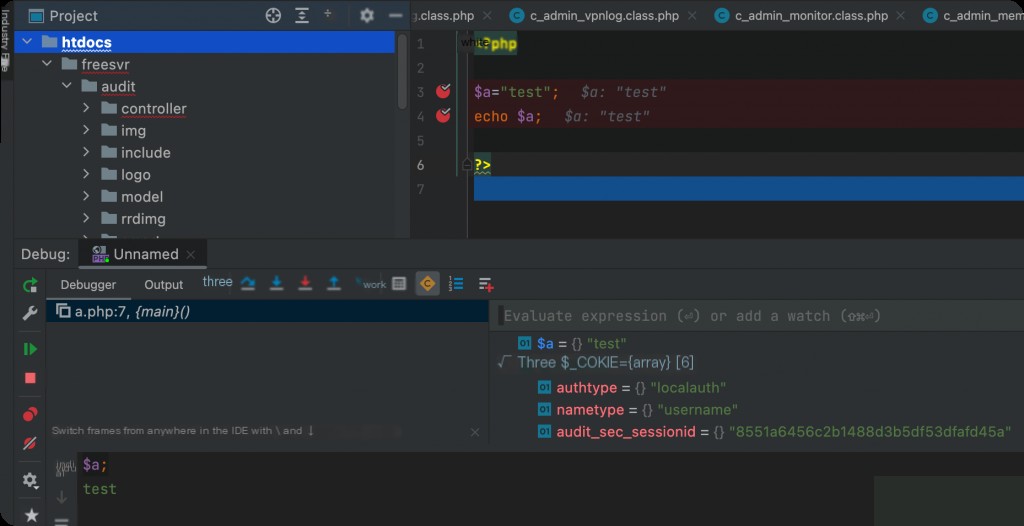
You can start the code audit now.