

Overview
What should you do when encountering network issues in a Kubernetes environment and need to perform packet capturing for troubleshooting? Traditionally, you would log in to the node where the Pod is located, then use the tcpdump tool on the node to capture packets. This entire process is rather cumbersome. Fortunately, the community has introduced this handy tool, which is a kubectl plugin that allows us to capture packets in Kubernetes more easily and quickly.
This article will introduce how to use the ksniff tool to capture packets for a Pod.
Installation
ksniff is typically installed using this kubectl package manager:
Real-time Analysis with Wireshark
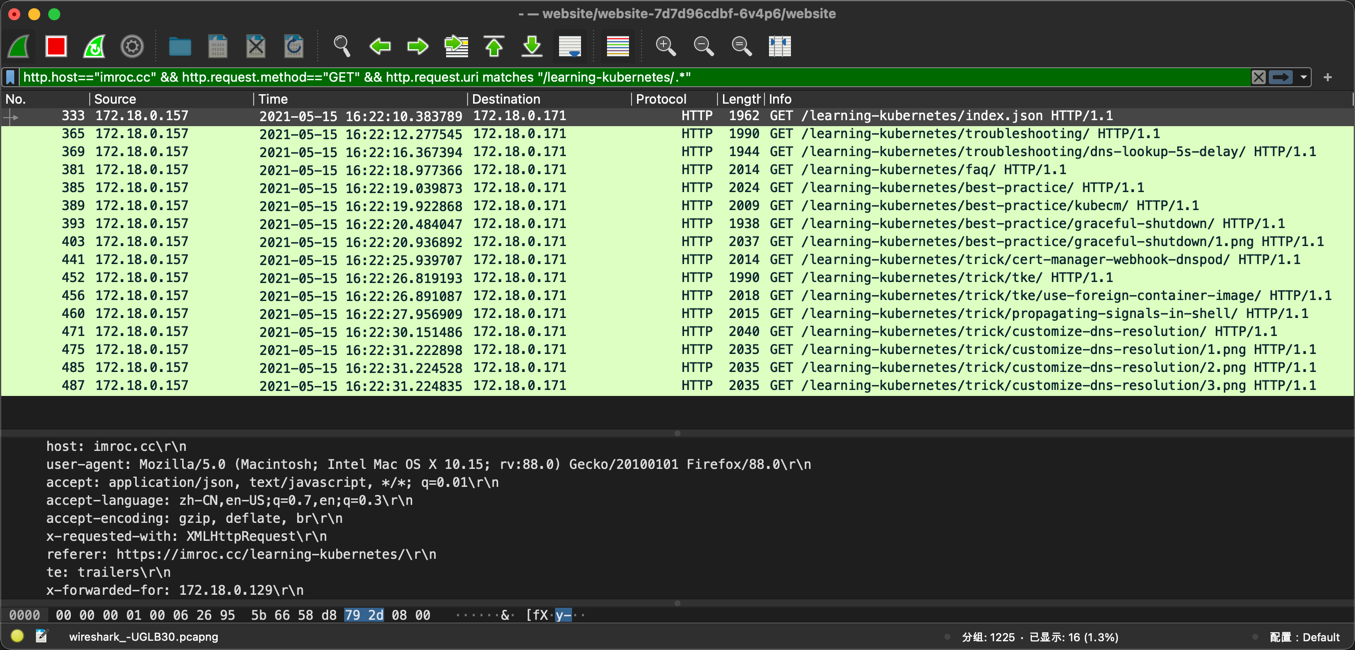
To capture all network card packets of a specified Pod and automatically pop up Wireshark installed locally for real-time capturing:
You can use Wireshark’s filters for real-time filtering and analysis!
Save Capture Files
Sometimes in a production environment, we may not be able to execute kubectl locally directly, needing to go through a jump host. In such cases, we can save the captured packets as a file and then copy it locally for analysis with Wireshark.
You just need to add a parameter to specify the path to save the file:
Privileged Mode
By default, ksniff uploads the tcpdump binary to one of the containers in the target Pod, and then executes the binary to capture packets. However, this method relies on the container being started as the root user. If not, packet capturing is not possible.
In this case, we can add a parameter to indicate that a privileged Pod will be created on the node where the Pod is located. This Pod will invoke the container runtime (dockerd or containerd, etc.), start a container as the root user, and attach to the target Pod’s netns. Then, execute the tcpdump binary in the container to capture packets.
Usage example:
View Plaintext
If many packets contain plaintext (such as HTTP), and you only want to see a rough plaintext content overview, you can specify to print the capture content directly to standard output (stdout):
Filter During Capture
Sometimes there is a large amount of data. If it’s not filtered during capturing, it might put a heavy load on the apiserver (as the data transmission goes through the apiserver). In such a situation, it’s best to specify tcpdump filter conditions during capture to shield unnecessary data and avoid excessive data volume.
Add a parameter to specify filter conditions, example:
FAQ
Wireshark Reports Unknown
When opening the capture file, an error is reported:
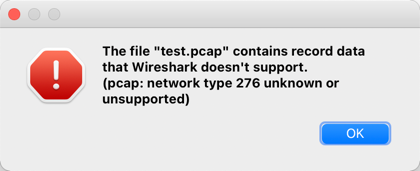
This is usually caused by a low version of Wireshark. Upgrade to the latest version to resolve it.
Capture Error: No such file or directory
When capturing packets using kubectl sniff, an error is reported and then it exits:
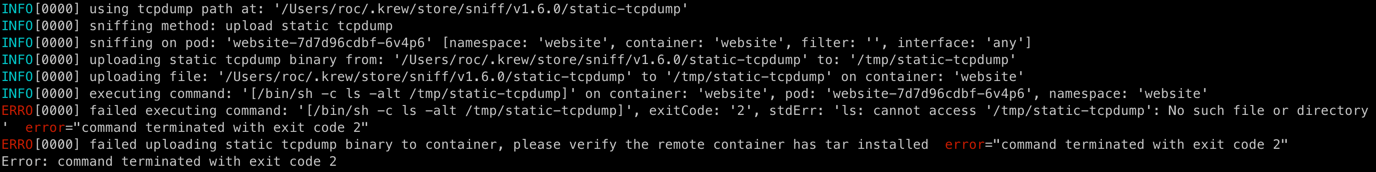
This issue was encountered by the author on macOS using the latest ksniff v1.6.0 version at the time. This is clearly a bug where the static-tcpdump binary was not uploaded successfully before execution. Three solutions are considered: