
1. Preparation for Network Threat Detection Deployment
1.1 What is the Security Onion Solution for Network Threat Detection
Security Onion is a free and open-source Linux distribution primarily used for network threat detection, enterprise security monitoring, and log management. It includes security tools such as TheHive, Playbook and Sigma, Fleet and osquery, CyberChef, Elasticsearch, Logstash, Kibana, Suricata, Zeek (formerly bro-ids), among others.
Security Onion started in 2008 (developed around the same time as OSSIM), initially based on the Ubuntu Linux distribution. Until the last major version of Security Onion, which was based on Ubuntu 16.04, it was called Security Onion 16.04, under the open-source License GPLv2.
The current SOS 2.3 Security Onion Solution is developed on CentOS Linux based on containers, named Security Onion 2, with the latest release being v 2.3.10 as of now.
Here are the differences between Security Onion 2 and the older system (v 16.04):
- Moved from Ubuntu packages to Docker containers;
- Supports CentOS Linux 7;
- Changed the pcap collection tool from netsniff-ng (used in versions prior to v16.04) to Google Stenographer (a new packet capture solution that quickly saves network packets to disk)
- Upgraded to Elastic Stack 7.x and supports Elastic Common Schema (ECS);
- Replaced the PF_RING kernel module with AF_PACKET;
- Suricata completely replaced Snort;
- Removed Sguil, Squert, and capME;
- Added storage nodes now called search nodes;
- Integrated new technologies including: TheHive, Strelka, support for Sigma rules, Grafana (host health monitoring and alerting), Fleet (for osquery management), Playbook (tool for detection playbooks), Onion Hunt, Security Onion Console;
1.2 Analysis of Key Components in Network Threat Detection
To facilitate understanding, below is a brief introduction to some key system components of SOS. Previous articles ( Li Chenguang: Quick Installation of Visual IDS System Security Onion (v 12) ) have introduced the concept of NSM (Network Security Monitoring). The NSM philosophy runs through the various software in Security Onion, which is a practice of collecting log information, analyzing network threats, and troubleshooting through multiple means.
- Elastic Stack is an important component for building the SIEM system in SOS.
- ElasticSearch provides three main functions: collecting, analyzing, and storing data.
- Logstash is mainly used for collecting, analyzing, and filtering logs. Logstash uses various input plugins to collect logs. It can also receive input data from OSSEC or Suricata.
- Kibana provides a user-friendly web interface for log analysis for Logstash and ElasticSearch. In the SOS system, there is no specially designed UI, and important data logs can only be summarized, analyzed, and searched through Kibana.
- Filebeat collects file data.
- Suricata: An open-source IDS that can alert on abnormal network behavior.
- Zeek (formerly bro-ids): Detects protocol banners on non-standard ports, collects HTTP client and server headers, collects DNS requests and responses, SSH, SSL certificates, LDAP / Active Directory, etc. During packet analysis, both Zeek and Suricata are very hardware resource-intensive.

1.3 Network Threat Detection Download
SOS is a system worth trying. You can download this large ISO file while reading the following related knowledge points.
Download the 2.3.10 ISO image (about 6.84GB) from the following link:
https://download.securityonion.net/file/securityonion/securityonion-2.3.10.iso
MD5: 55E10BAE3D90DF47CA4D5DCCDCB67A96
SHA1: 01361123F35CEACE077803BC8074594D57EE653A
SHA256: 772EA4EFFFF12F026593F5D1CC93DB538CC17B9BA5F60308F1976B6ED7032A8D
1.4 Core Functions of Network Threat Detection
The biggest feature of Security Onion is that although it is highly integrated, the user installation interface is relatively simple. Another feature is its novelty. I believe many open-source software are not familiar to everyone. Since it is developed based on CentOS Linux, all security components are specially configured and perfectly integrated with the operating system, so even “laymen” can deploy this system and get started.
Security Onion provides three core functions:
1) Full Packet Capture: Full packet capture is achieved through Stenographer, which captures all network traffic of the Security Onion sensor. It’s like a network camera capturing network data packets.
2) Network and Endpoint Detection: Analyzes network traffic or host systems and provides log and alert data for detected events and activities.
3) Powerful Analysis Tools: SOS tightly integrates the following tools:
- Security Onion Console (SOC) can view all NIDS and HIDS alerts. Functionally, this is far from a security operations center (SOC), but it is very eye-catching, isn’t it?
- The Hive can discover many event alerts and logs.
- Kibana: Allows us to quickly analyze and analyze all different data types generated by Security Onion through a “single pane of glass”.
- CyberChef: Allows you to decode, decompress, and analyze data packets.
- Playbook: Used to create detection playbooks, which are completely independent and describe different aspects of a specific detection strategy.
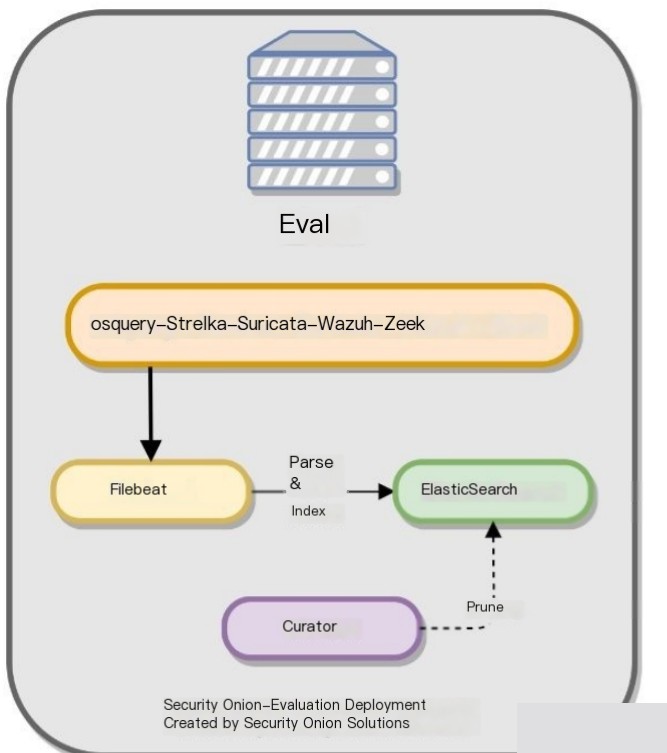
1.5 Network Threat Detection Architecture
SOS not only includes Elastic Stack (a complete big data processing system from log input, transformation to storage analysis, and visualization) but also adds the following content (these three components run as Docker containers in Security Onion):
- Curator: Mainly used to help manage Elasticsearch indexes and snapshots.
- ElastAlert: Used to query ElasticSearch and provide alert mechanisms with various output types.
- FreqServer: Used to analyze frequently accessed fields and provide access frequency rankings.
Note: Here we are installing in a small lab using the EVAL (evaluation) mode. For production environments, it is advisable to use a distributed installation mode.
1.6 Log Extraction in Evaluation Version for Network Threat Detection
Core Pipeline: Filebeat [EVAL node] –> ES Extraction [EVAL node]
Logs: Zeek, Suricata, Wazuh, Osquery / Fleet
Osquery Sender Pipeline: Osquery [endpoint] –> Fleet [EVAL node] –> ES Extraction through Core Pipeline
Logs: WEL, Osquery, syslog
In the following experiment, an independent installation method is used. This method consists of a single virtual machine running server and sensor components and related processes, making it most suitable for beginners.
1.7 About Network Threat Detection in Docker
Since SO 2.3.1 uses Docker CE v19.0.3 containers, Docker CE (Docker Community Edition, the free version of Docker products) includes the complete Docker platform, making it very suitable for developers and operations teams to build containerized apps. When using SO 2.3.1, you will encounter many ELK and Docker knowledge points.
2. System Installation
SOS 2.3 is a more powerful new platform compared to the previous Security Onion. The new software is very advanced, so these additional features also lead to higher hardware requirements. After testing, SOS can be smoothly installed under VirtualBOX and VMware workstation (if your configuration meets the requirements).
Assuming the monitored link bandwidth is 1Gbps.
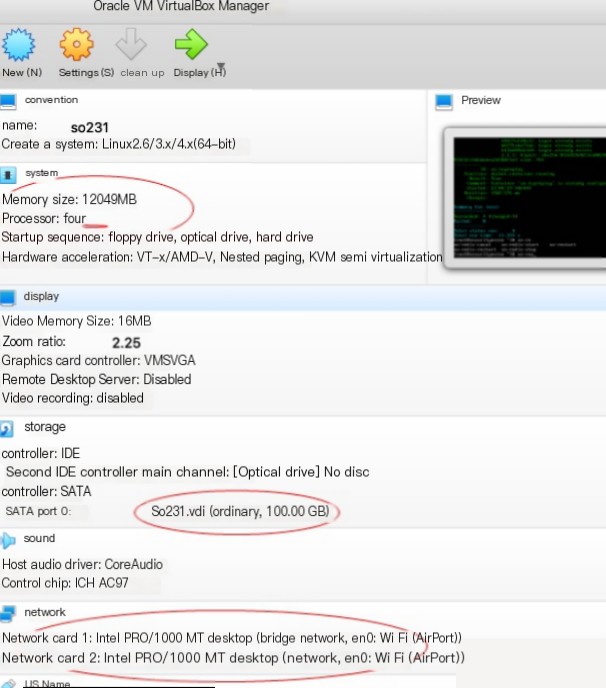
2.1 Minimum Installation Requirements:
CPU: 4+ Core
The Suricata and Zeek services in the SOS system will occupy a lot of CPU resources when running. The more traffic monitored in the network segment, the more CPU cores are needed. Running Suricata and Zeek services on a full line-speed 1Gbps link requires at least a 10 Core CPU to meet the needs.
Disk: 100+GB, recommended 200GB.
Due to the bottleneck of multiple Docker applications in the system being exposed on I/O, SSD is strongly recommended, at least RAID1+0 disk array.
RAM: 12+GB
12GB is the minimum requirement for installation. To run smoothly, at least 16GB of memory is recommended, with 64 or 128GB being ideal. Large memory is used for disk caching for Logstash, Elasticsearch, Lucene, Suricata, Zeek, etc. The size of the memory will directly affect search speed and system reliability (too little memory will cause core service crashes) and the ability to process and capture traffic.
Network Adapter: 2 NICs
One wired network interface dedicated to management, using a static IP address. The other NIC has no IP address and is dedicated to sniffing. For production environments, an Intel 10 Gigabit NIC is recommended.
About Storage:
SOS 2.3 is a compute-intensive and disk-intensive big data analysis platform. When full packet capture is enabled, the data captured by the sensors requires a large amount of disk space2.2 Installing via ISO in a Virtual Machine
The following virtual machine uses the latest version of VirtualBOX. The parameters for the new virtual machine meet the necessary conditions mentioned above. Virtual machine (Oracle VM VirtualBOX) settings:
In this article, we use an ISO image file for installation. If you prefer to install via USB, we recommend using Balena Etcher to write the downloaded ISO image file to a USB drive (16+GB) to create a bootable USB drive and adjust the BIOS boot order accordingly.
Below, we install using the ISO file in the virtual machine. First, select the graphical mode to install the system.
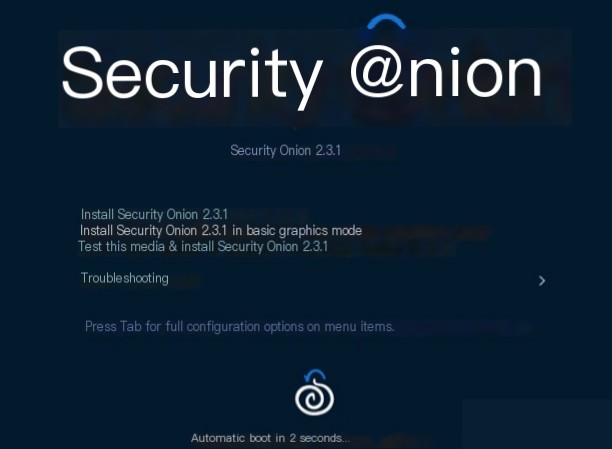
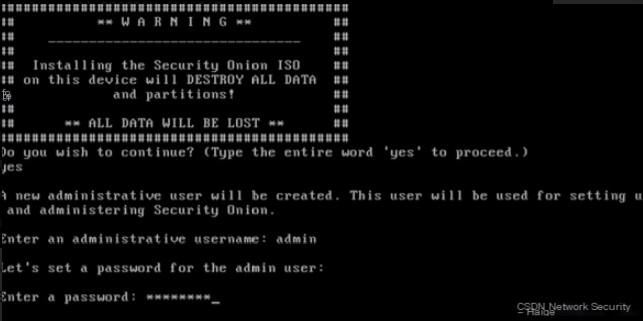
Installation Warning: Here, enter the administrator name ‘admin’ (different from the root user) and enter the password. Press Enter to start installing the basic system. After ten minutes, a basic system installation is complete. The long process is still ahead.
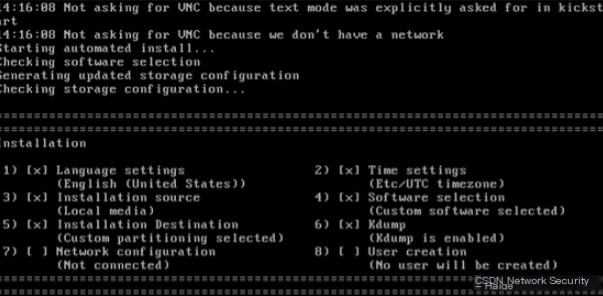
By pressing the “Alt+Tab” key combination, you can switch between four modes:
- Main Installation Interface
- Shell
- LOG
- Storage-lo
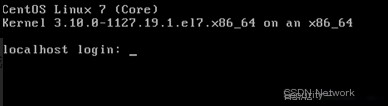
After the system installation is complete, it will automatically restart.
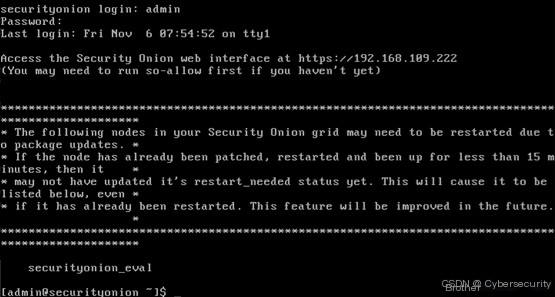
After about fifteen minutes, the initialization installation phase is complete. At this point, press Enter to restart the system. Log in to the system again, this time entering ‘admin’ and the password.
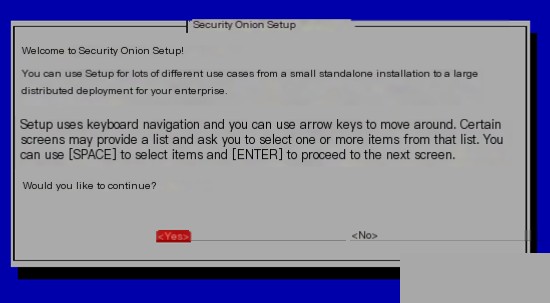
Follow the system prompts and enter Yes. Next, we start configuring the system.
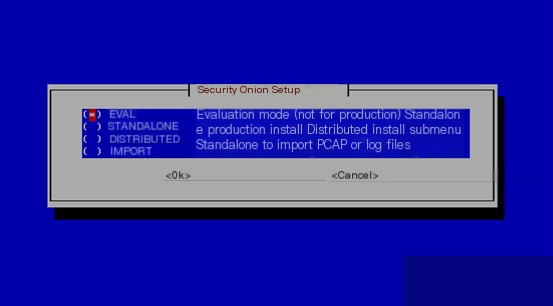
In the image below, we select the first option “EVAL” (evaluation version).
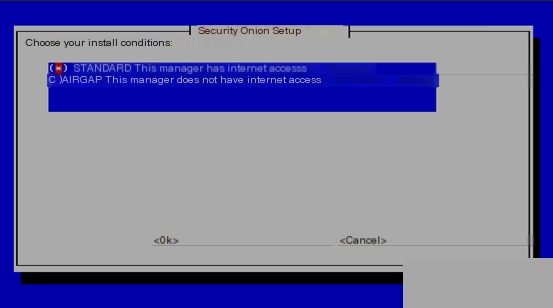
Select the standard mode installation.
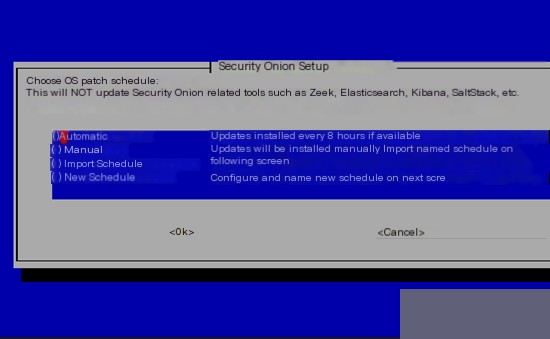
Next, choose automatic updates.
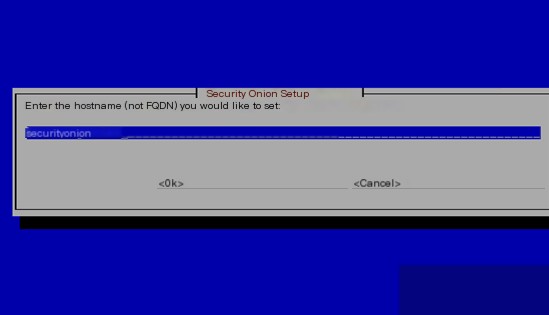
Enter the hostname.
Upon analysis, it was found that during the “Updating packages” phase, the system is not being installed from the network (network packet transmission is almost zero).
Next, select a network interface, usually the first one, and assign it a static IP address, gateway, and DNS.
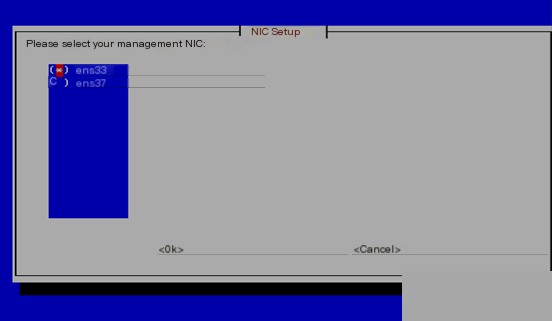
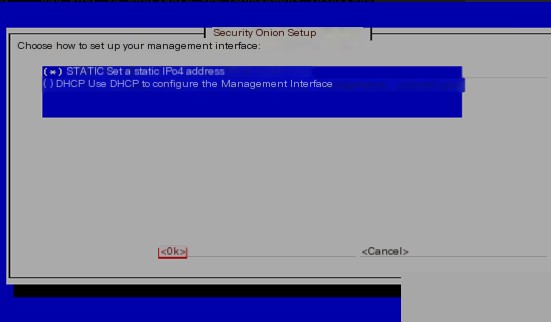
Skipping a few screenshots of the network settings.
After setting up one network card, start setting up another network card. The second network card is the sniffing card, set it to sniffing mode, and enter the CIDR number of the monitoring segment.

If you wonder why not set the server to DHCP or why not assign an IP address to the second sniffing network card, please review the basics (server deployment content in the OSSIM Best Practices book).
Next, continue with the installation, selecting components (can be optional).
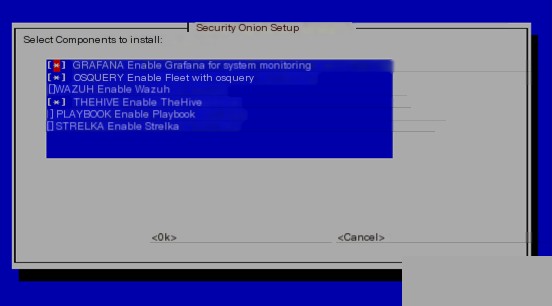
Hmm~ o(* ̄▽ ̄*)o?? Why select components again? Isn’t it repetitive? Let’s continue. This part of the installation and configuration takes about 1 hour. Disk partitioning and operating system component settings are automatic, and if you terminate this process, the entire installation will be in vain.
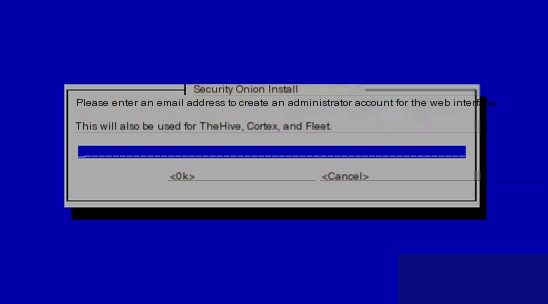
Enter an email address as the login username.
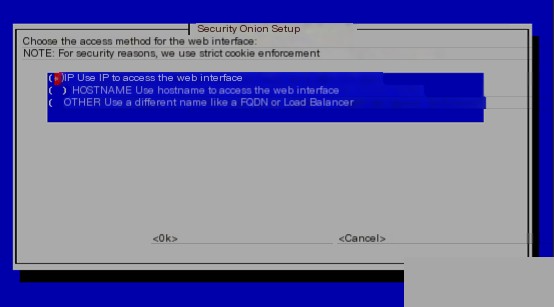
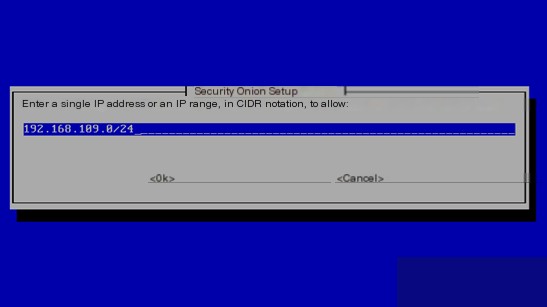
Set up the access whitelist: it can be a single IP or a network segment, but it is not recommended to set a hostname or FQDN name.
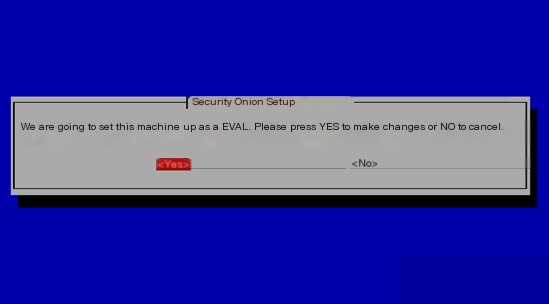
After completing the above steps, the system will install the following components in the later stages. It’s not done yet, and you might be getting impatient. If the next phase is terminated, it will also cause the system installation to fail.
- Generate CA center
- Copy containers from ISO
- Apply idstools salt state
- Apply elasticsearch salt state
- Apply pcap salt state
- Apply zeek salt state
- Apply curator salt state
- Apply soc salt state
- Apply kibana salt state
- Apply utility salt state
- Verify installation
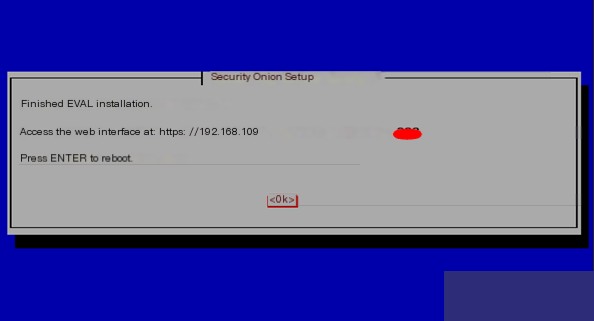
When you see the system prompt to press Enter to restart the system, it means the entire system installation and configuration are complete, and you can restart the system.
Note: After the system installation and configuration are complete, the virtual machine folder size is about 22GB. If your disk space is less than 30GB, it will cause the configuration process to terminate unexpectedly, and the entire installation will be in vain!
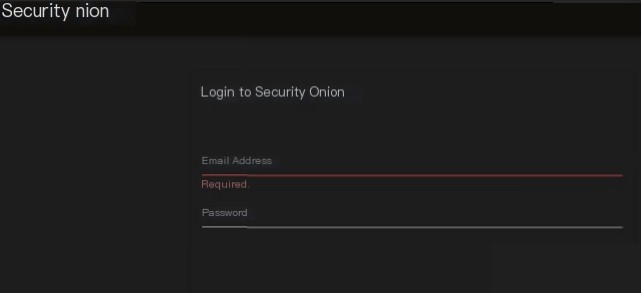
Now you can enter the IP address in the client browser’s address bar, and the login screen will appear. Enter the email address and password you just set to log into the system.
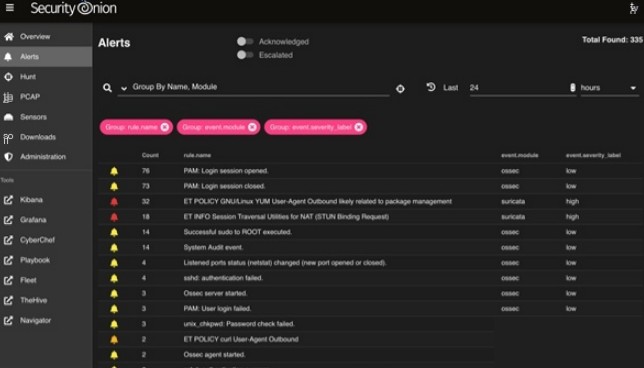
2.3 Key Elements SOC Alert Console
The Security Onion Console (SOC) allows you to access our new alert interface. This interface provides an overview of the alerts generated by Security Onion. In the figure, enabling the Acknowledged toggle will only display alerts that have previously been acknowledged by analysts.
Enabling the Escalated toggle will only display alerts that have previously been escalated to TheHive by analysts.
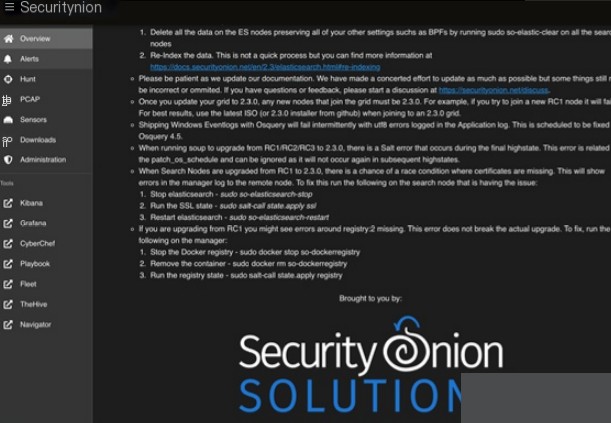
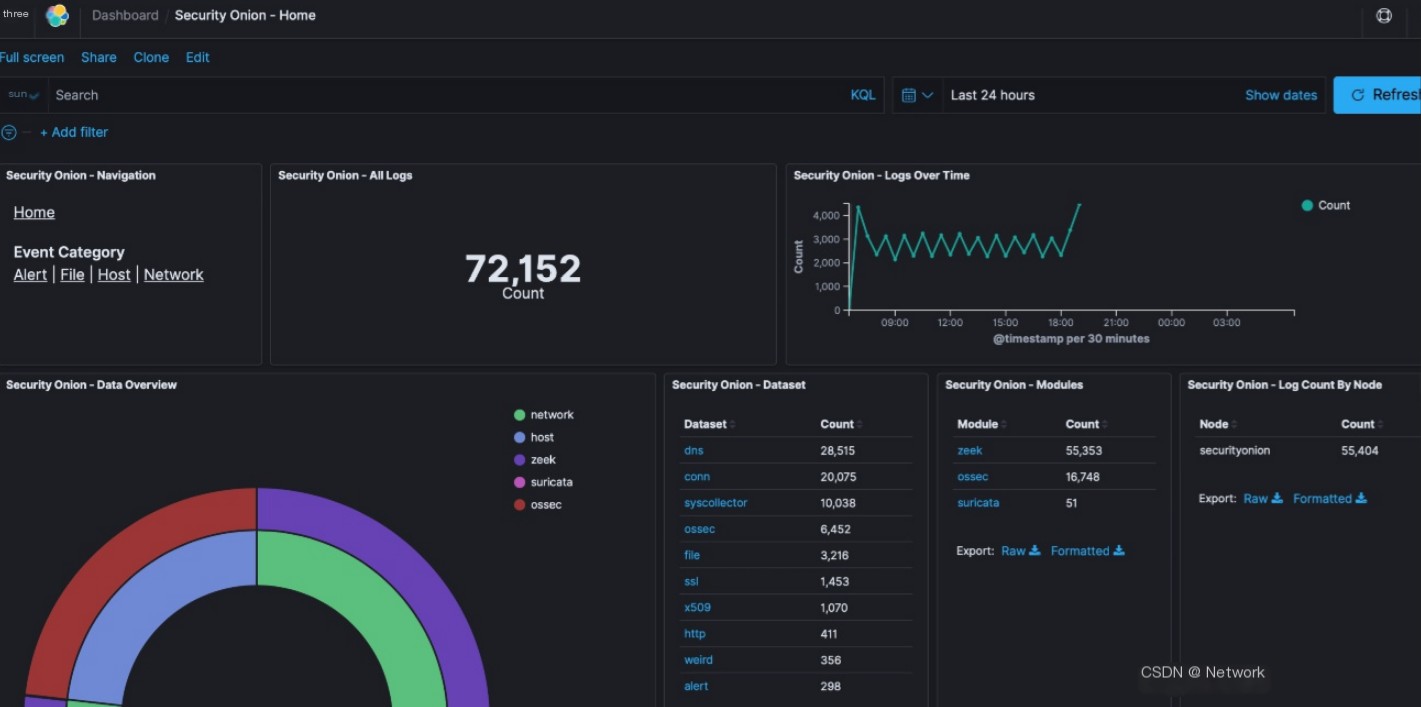
Seeing the interface below, does it look familiar? The following is an overview of Security Onion data, which is also the homepage of the dashboard. The content is quite long, and the image below only captures a portion.
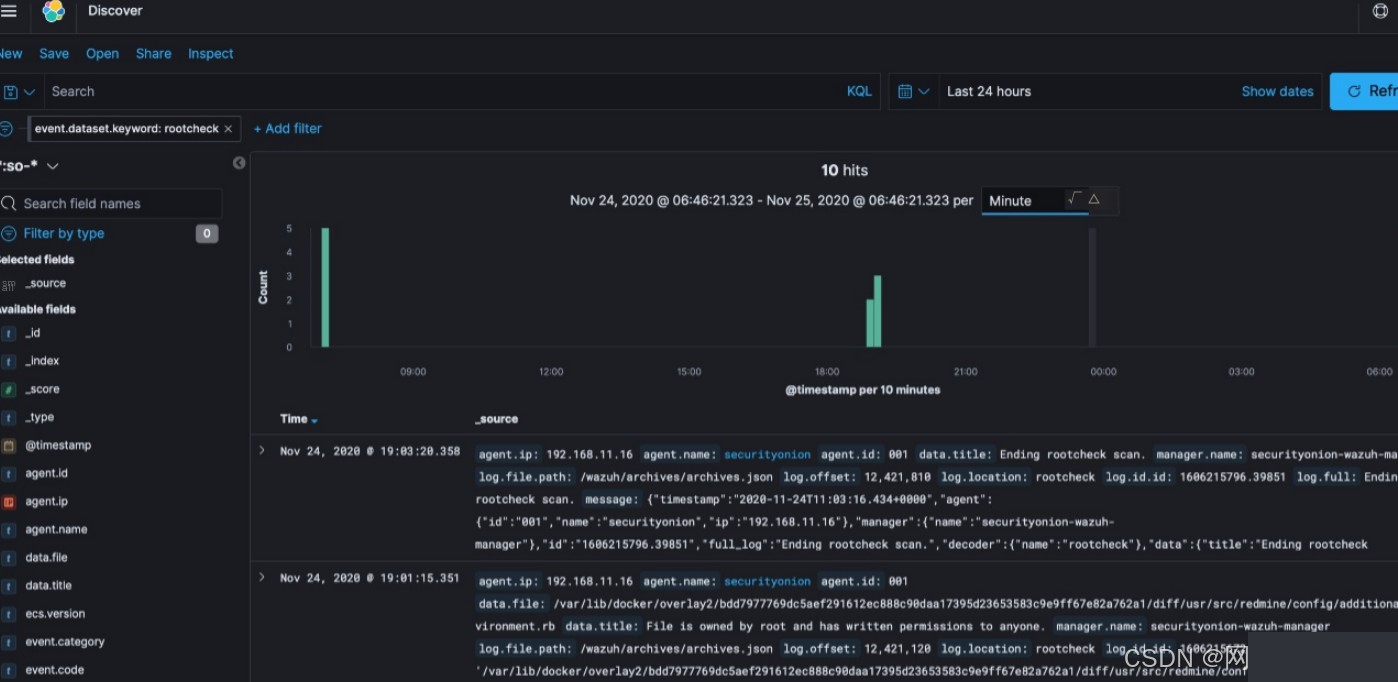
View log messages
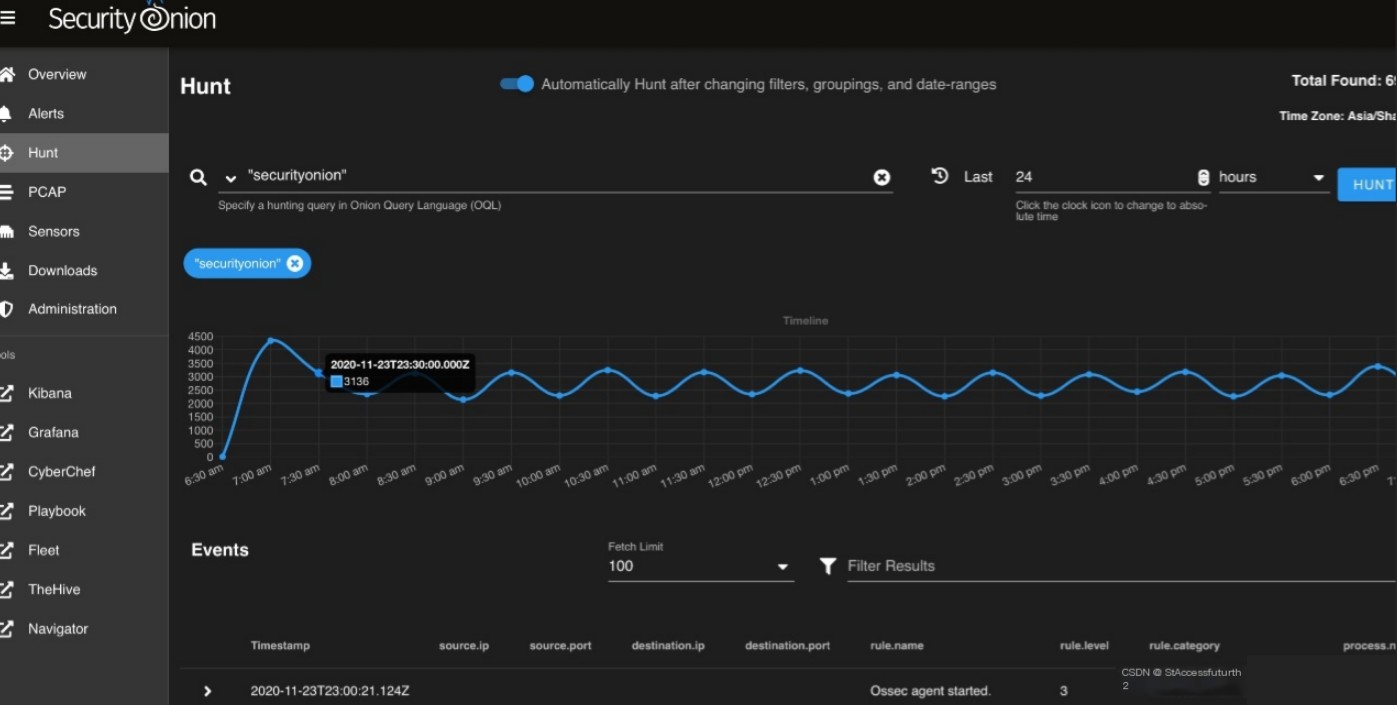
Hunt event (View threat hunting events)
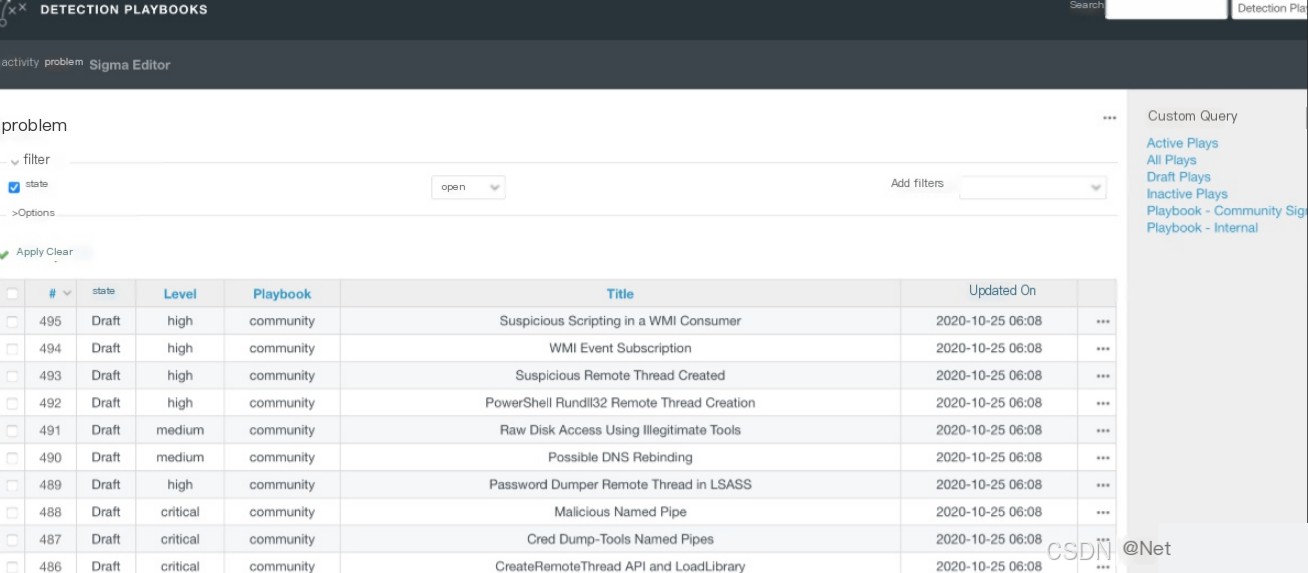
System built-in PlayBooks
No need to install the system’s built-in performance monitoring tool – Grafana. It is an open-source data visualization tool developed in Go language, capable of data monitoring and statistics, and comes with alerting features.
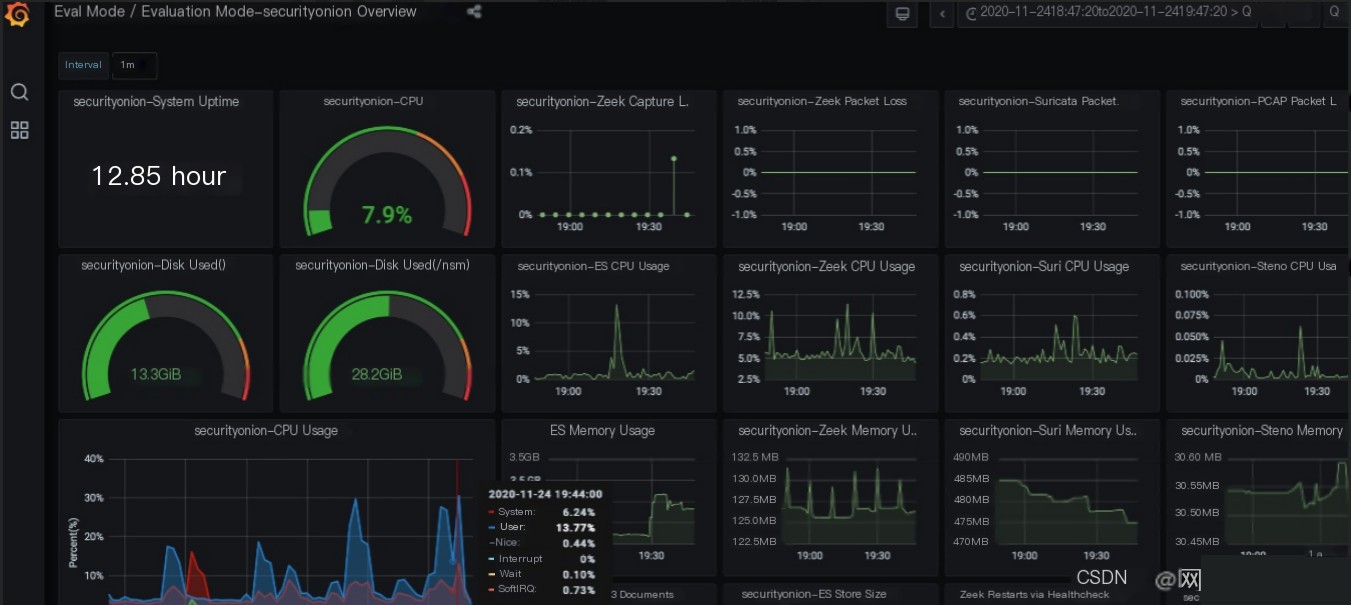
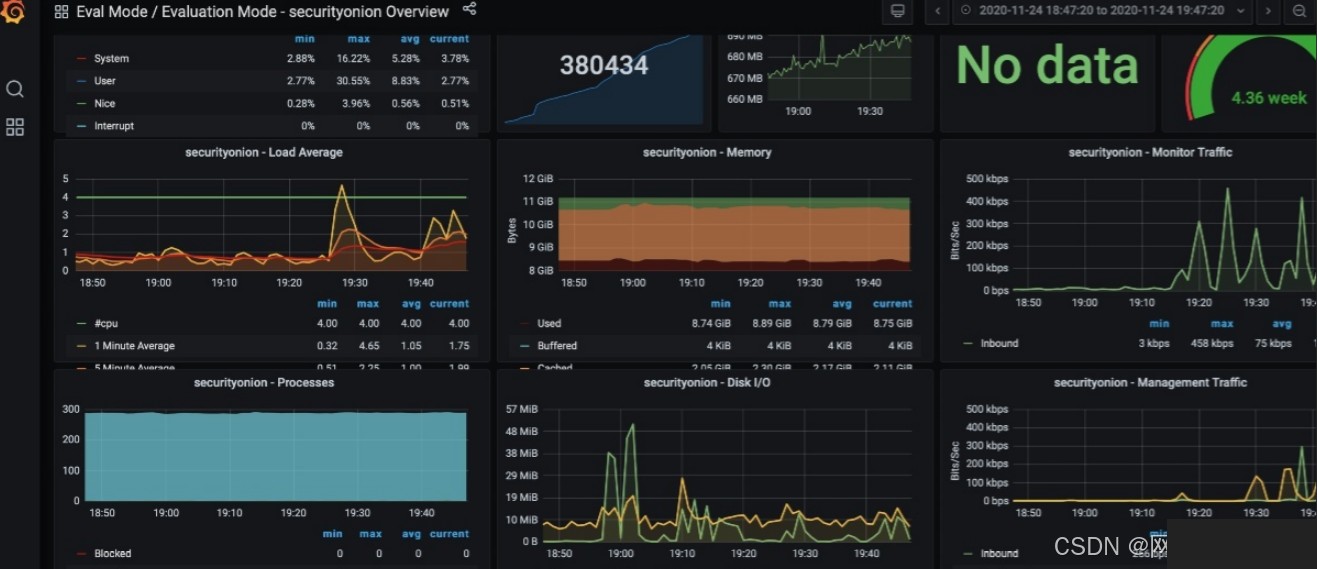
There are many more GUI interfaces, which will not be displayed one by one here. This completes the entire system installation.
3. Essential Commands
3.1 System Status Check
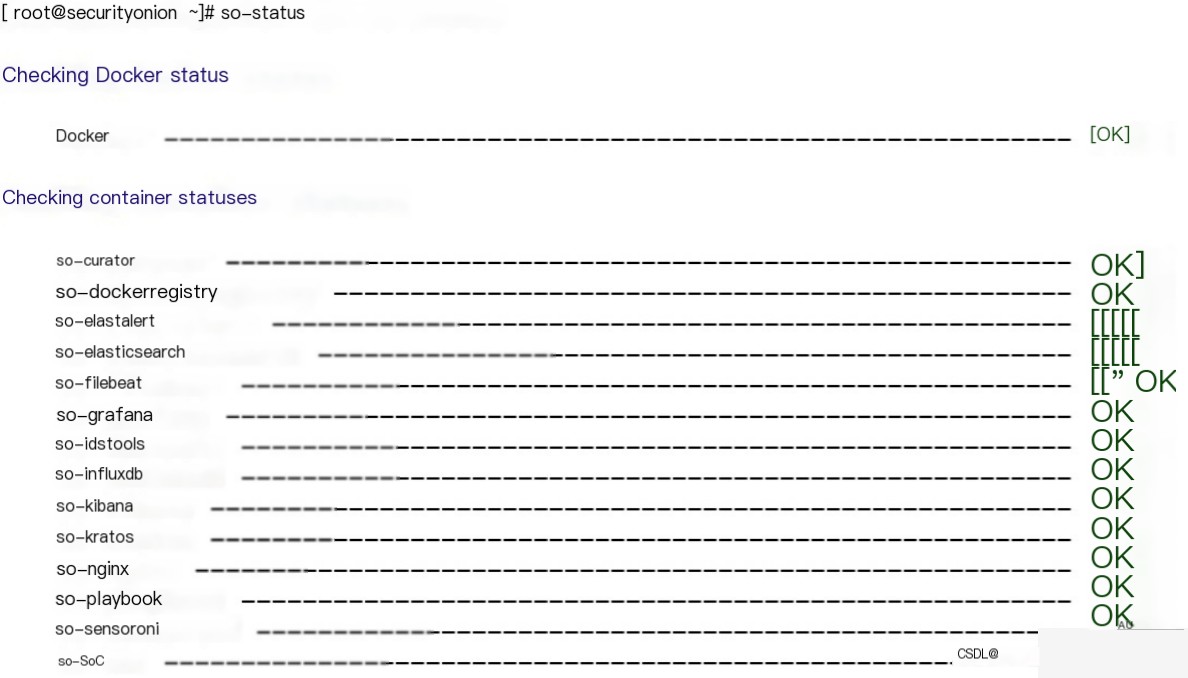
If all services start normally, the corresponding prompts will be “OK”.
What to do if an error occurs when starting the service?
Below is an example of an abnormal situation
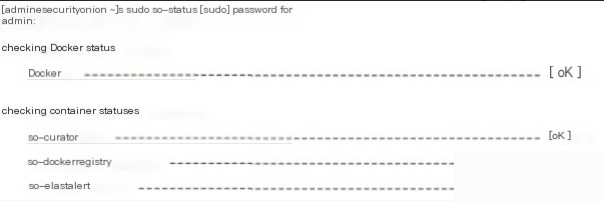
We found that the so-elastalert service encountered an ERROR. Other services are normal. Enter the following command to restart the service.
[admin@securityonion ~]$ sudo so-elastalert-restart
3.2 View Docker Images
We know that Docker Hub ( https://hub.docker.com/u/securityonion/) can be used to manage public images, which contain a wealth of resources. We can also push our own images there. In the SOS usage scenario, it has a private image repository to manage the built-in images of SOS.
The system is installed via the SecurityOnionISO image, and then the Docker engine and these Docker images can be obtained directly through the ISO file (the docker directory compressed package in the ISO file).
To view the Docker image file information, enter the following command:
- [admin@securityonion ~]$ sudo docker image
4. Test Alerts
When setting up a new system, everything is unfamiliar. If you don’t have SIEM operation and maintenance experience, this system will be difficult to manage. Suppose you have used OSSIM or other SIEM systems before. You will definitely want to know how to verify the functionality of SOS. The main thing is to see if its network alert function is strong and how to trigger alerts. There are two methods:
- By replaying network attack packets, i.e., replaying PCAP files (the system has dedicated PCAP files for testing, which can be replayed through scripts). After executing the packet replay method, the following operations will be triggered:
- 1) Suricata generates IDS alerts
- 2) Zeek generates network metadata
- These triggered IDS alerts and network metadata will be stored in Elasticsearch. We can query them through the Security Onion Console (SOC) in the WebUI interface. What are the tips and tricks for network packet replay? You can refer to “Open Source Security Operations Platform OSSIM Troubleshooting”.
- Through TAP or SPAN methods
5. Import External PCAP Files
Sometimes we need to import PCAP files captured from external systems into the SOS system for analysis. The following method can be used.
Place the PCAP in the specified directory /opt/samples/
[admin@securityonion docker]$ sudo ls /opt/samples/1.pcap
Enter the command: sudo so-import-pcap /opt/samples/1.pcap
6. Essential Information
- Let’s review the system installation conditions in All in One mode, which are also the minimum requirements
- CPU: 4+ Cores
- Disk: 100+GB
- RAM: 12+GB
- Network Adapter: 2 NICs
- Image file installation, capacity 6.84GB
- System installation duration: 90 minutes
- The SOS system uses an optimized CentOS 7 Linux system, with built-in Docker CE v19.0.3 containers. Each component runs based on Docker. This powerful network threat detection and enterprise log management solution can play an important role in daily security management. For beginners, its installation and deployment difficulty is slightly higher than OSSIM.
Next issue preview: We will analyze the uses of Docker containers in SOS, stay tuned!
Note: If installed on a virtual machine, it is not recommended to install VMware Tools in the system, as it will affect the operation of the Docker bridge interface. If you find the system installation difficult, you can refer to the video installation tutorial Security Onion Solutions Deployment Guide