The installation, deployment, maintenance, and pros and cons of Moloch have already been discussed in an article submitted by Cherishao on Security Road “The Things About Moloch That Must Be Said”
There aren’t many detailed guides on using Moloch online; many articles just copy content from various sources. This manual primarily summarizes related functionalities based on personal use, referencing the official documentation to provide a more detailed introduction to Moloch’s traffic retrospective system capabilities.
In my work experience, I use a nation’s full traffic analysis system. Comparatively, I believe Moloch, as an open-source system, has very powerful functions for parsing traffic data, allowing for elaborate filter construction. However, since it focuses on traffic, it doesn’t have common detection mechanisms based on behavior or characteristics. If needed, it can be supplemented with detection systems like Snort, Bro, Suricata. (Moloch can integrate Suricata as a plugin, interested friends can try it out.)
The methods presented are my personal understanding, which may contain biases. They’re presented here to spark conversation and hope for guidance and feedback from experienced folks!
1. Sessions Interface
 >
>
Search Bar
Enter filter expressions, click search to query.
Applying & Creating Default Filters
After setting beforehand, specific conditions can be used as default filters.
As shown in Figure 1-2: Select the predefined rule to query all captured TCP data, then retrieve TCP data related to IP 10.0.1.1.
 >
>
Clicking “New View” allows you to add new default filtering conditions.
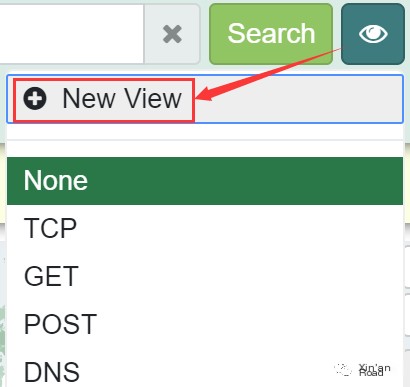
Figure 1-4 illustrates setting the default filter name and corresponding filter expressions.

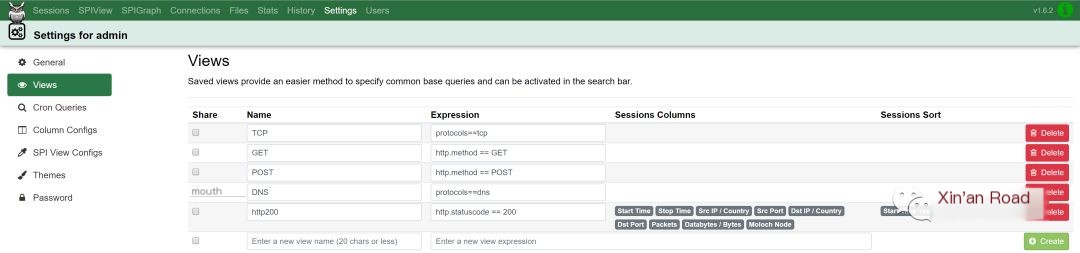
You can click “Views” in the Settings panel to view the default filtering configuration.
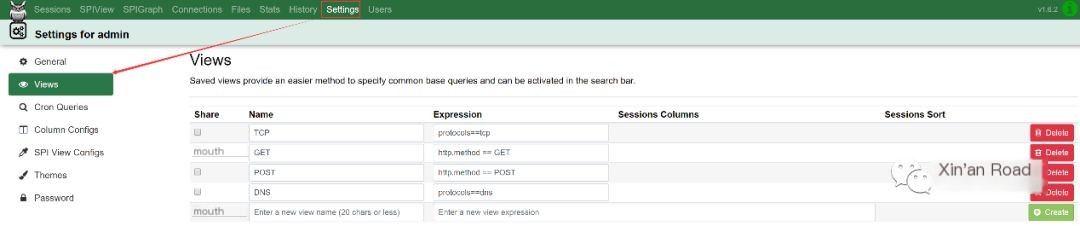
Note: During my trial, when creating a new entry, Name cannot be in Chinese characters.
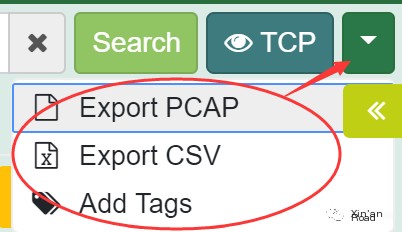
Export Filter Results
Export query results, save as PCAP format or CSV format.
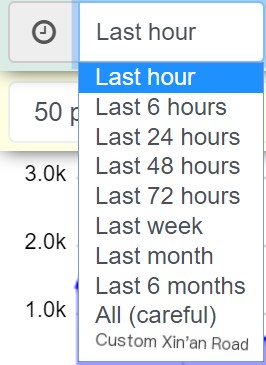
Select Interval Retrospective
Specify retrospective interval, click “Search” to query data.
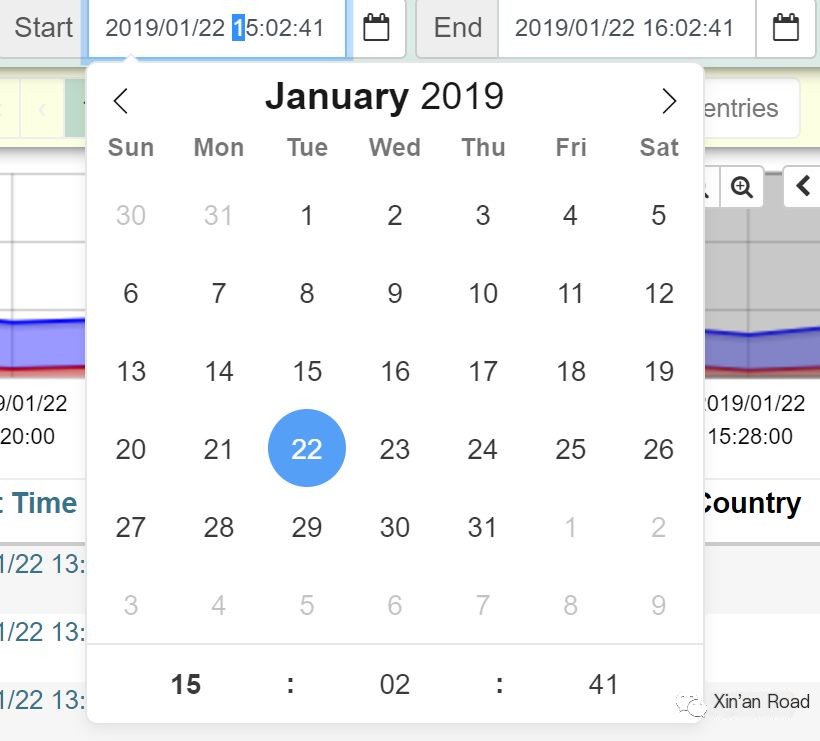
Specify Time Range Retrospective
Specify a time range, click “Search” to query data.
Session Selection Method
Since each session has a first packet, last packet, and corresponding database timestamp, you can select sessions based on these conditions:
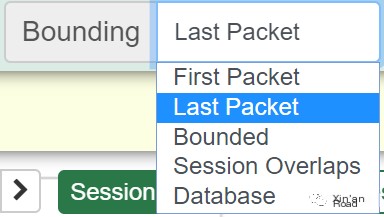
First Packet: Display captured sessions in ascending time order in the session display panel within the selected range.
Last Packet: Display captured sessions in descending time order in the session display panel within the selected range.
Bounded: Filters completed session data.
Session Overlaps: Filters sessions for which the first packet is captured but not the last packet (i.e., sessions are ongoing).
Database: Displays sessions by the time written into the database (there may be a delay, likely a few minutes after receiving the last packet).
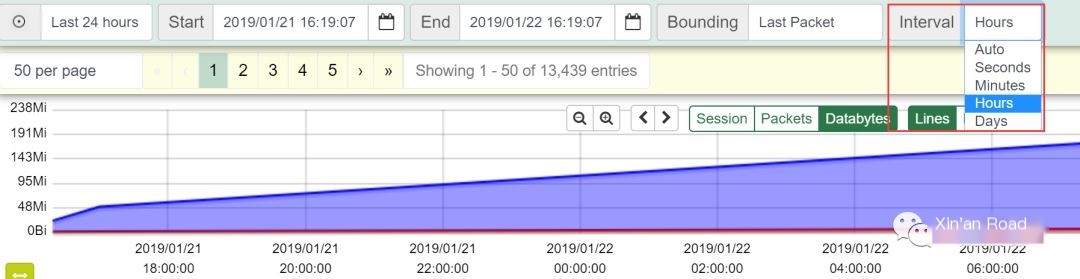
Traffic Trends
Displays traffic trends per unit of time (default is hours).
Session Display
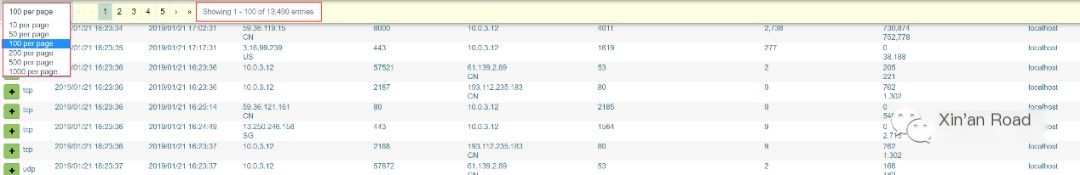
Set the number of sessions shown on the Sessions page (the default page displays 50 sessions).
You can also see the total number of sessions in the current query result.
Traffic Panel

Shows real-time monitoring trends.
The magnifying glass is used to adjust the displayed time interval
sessions, packets, databytes are three forms of display
You can choose to show traffic trends as line (Lines) or bar (Bars) charts
Source & Destination
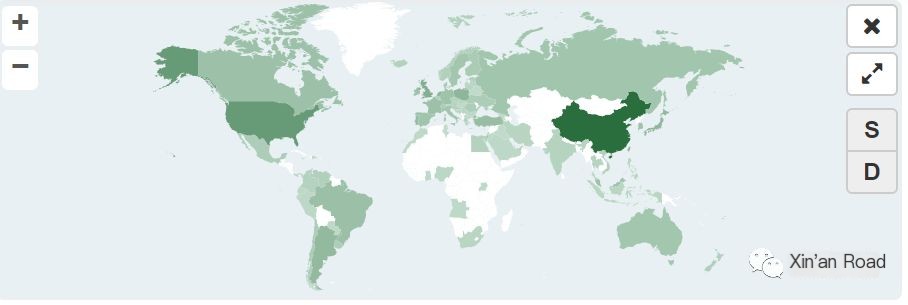
Show the geographical location of both communicating parties on the map
S (source country)
D (destination country)
Window Adaptation
Click the button shown in figure 1-14 to make the information displayed in each column below auto-adjust to the window.
Before adaptation:
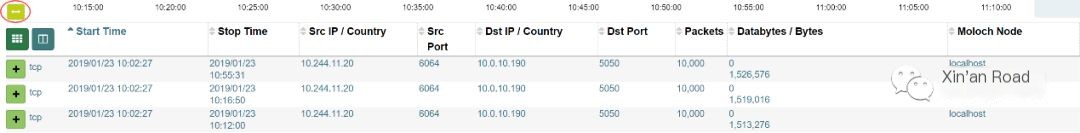
After adaptation:

Data Information
As shown in Figure 1-16, metadata information like source IP, source port, destination IP, destination port, etc. is displayed.
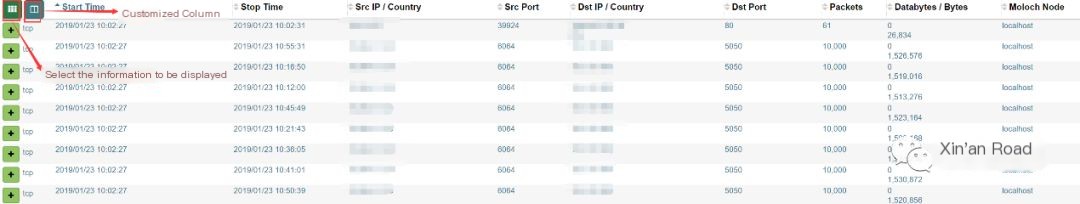
By clicking the button shown in figure 1-17, you can apply the fields you want to display on the page as columns.
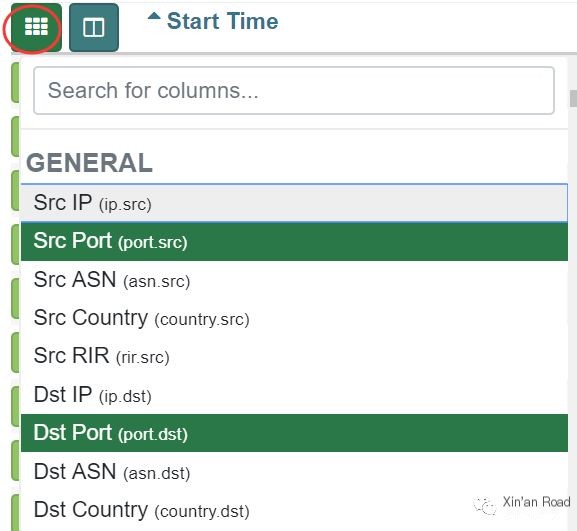
Click the button beside it to form a configuration of the chosen columns displayed on the page and name it.
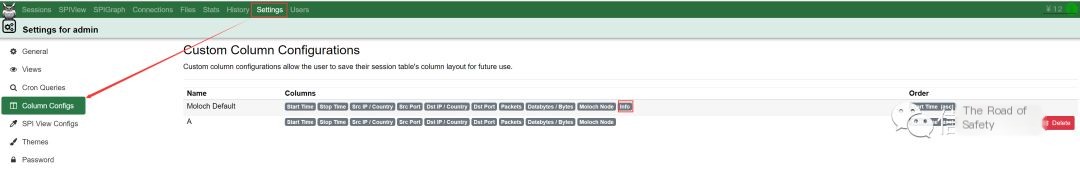
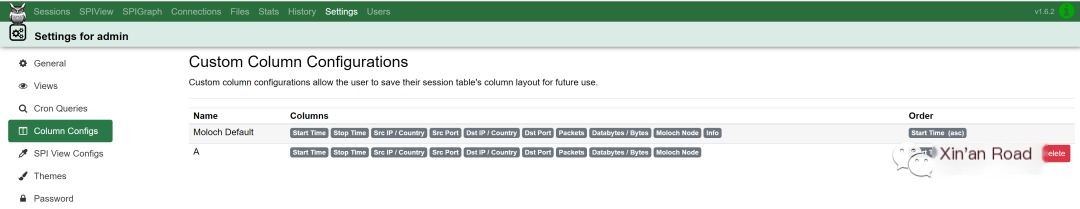
As shown in Figure 1-18, besides the default configuration (Moloch Default), a configuration named “A” is also customized.

By viewing the “Column Configs” entry in the “Settings” panel, the difference between the default configuration and the “A” configuration can be clearly seen—selecting the default configuration adds an “info” column.
Click the ‘+’ before each session to display the complete session information.
Click “Download Pcap” or select “Export Pcap” from the dropdown “Action” menu to download the packet.
All field names have a dropdown menu.
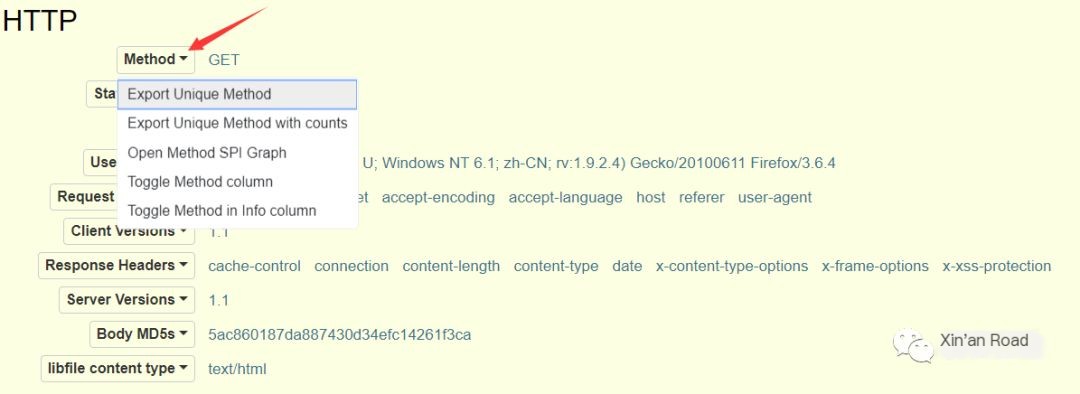
Using Figure 1-21 as an example, the five operations are explained:
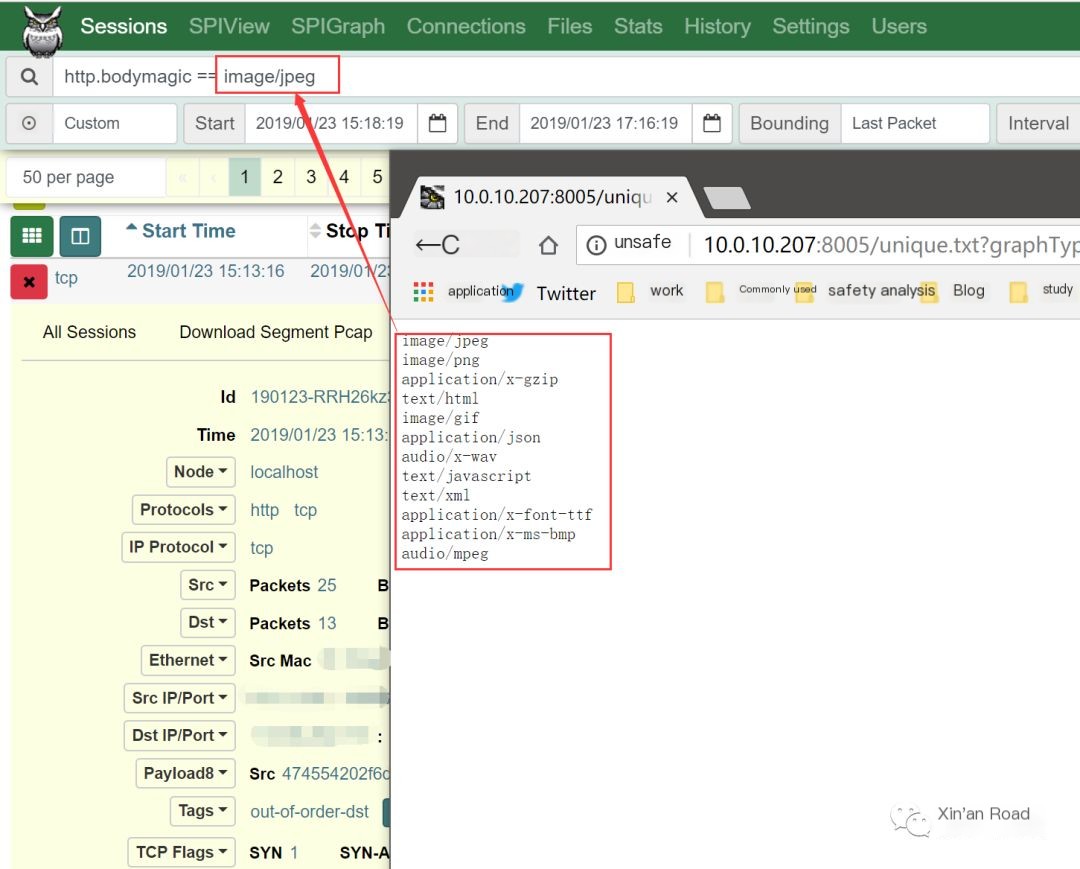
Export Unique Method (display supported HTTP methods)

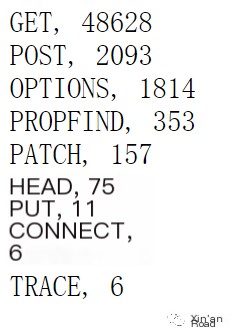
Export Unique Method with counts (counts various HTTP request methods in the selected interval)
Open Method SPI Graph (statistics of HTTP request methods in SPIGraph interface)
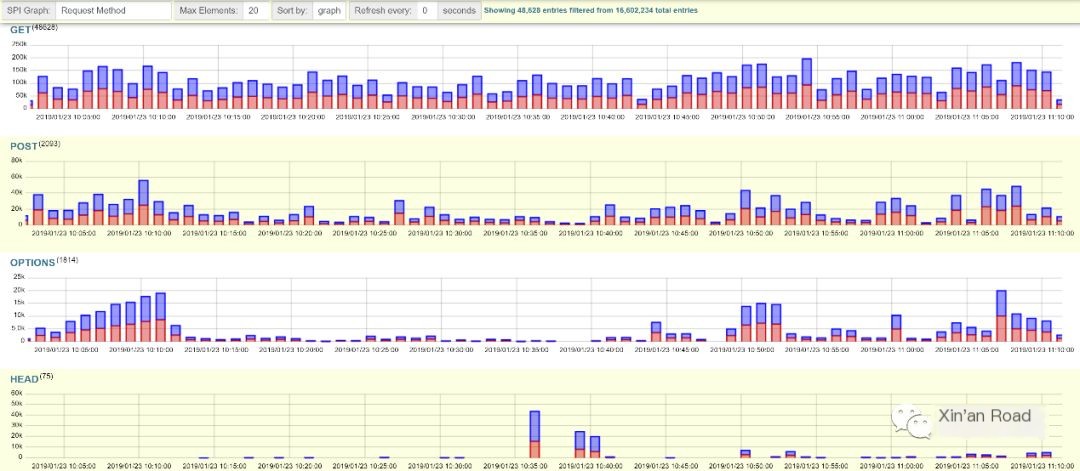
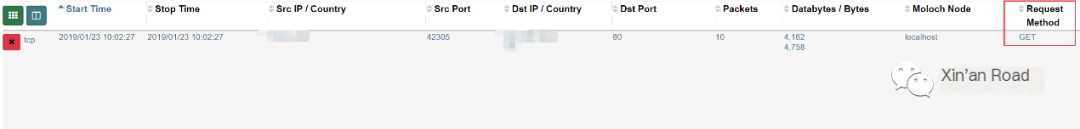
Toggle Method column (apply Request Method as a column)
Toggle Method in info column (show details of this request in the info column)

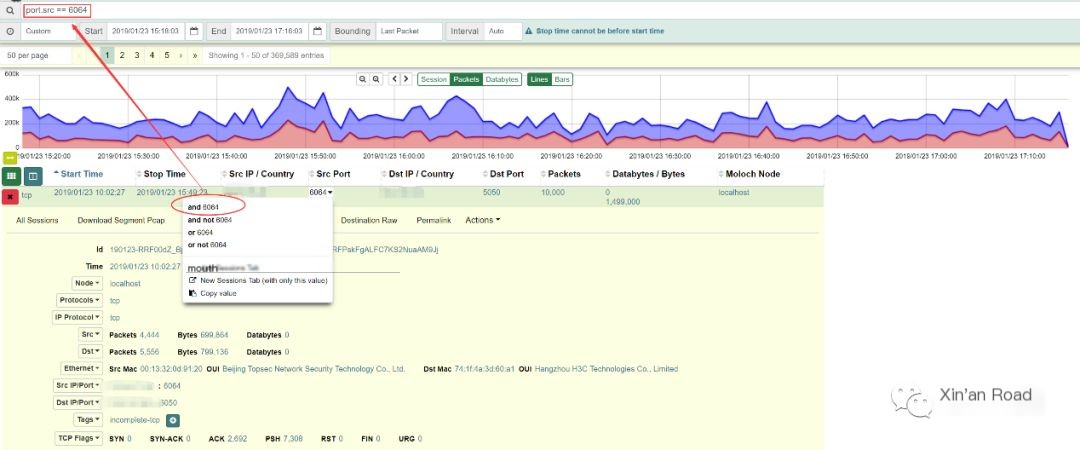
The value of fields in sessions can expand dropdown menus, select conditions, and set as corresponding filter rules.
Tip: This operation on metadata combined with the previously mentioned Export Unique Method can construct desired filter statements!
For example:
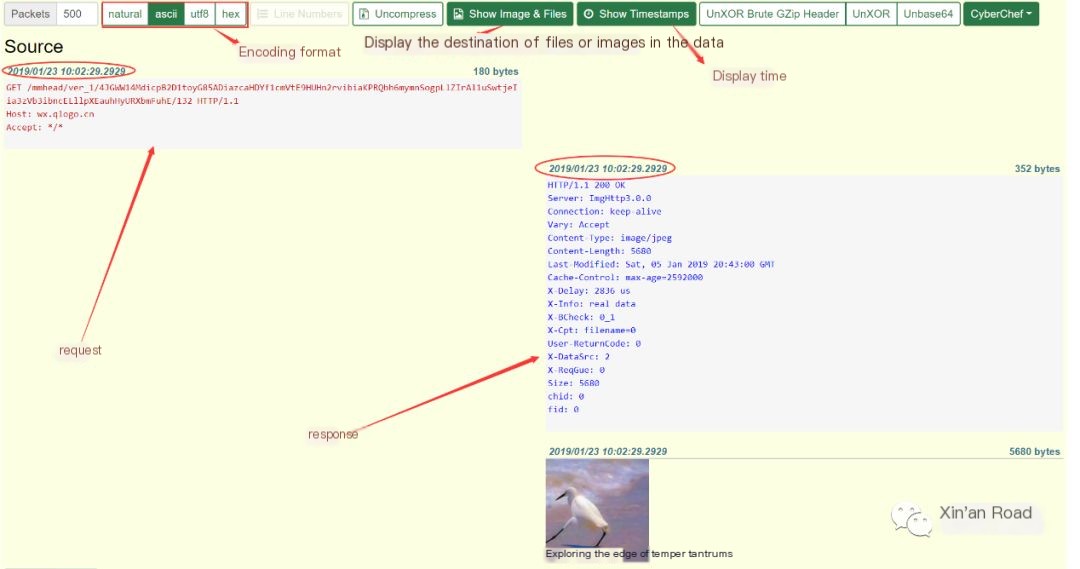
In the figure below, the session uses the GET method to request an image. To query sessions that request images, click
and image/jpeg, which will generate corresponding filter statements.
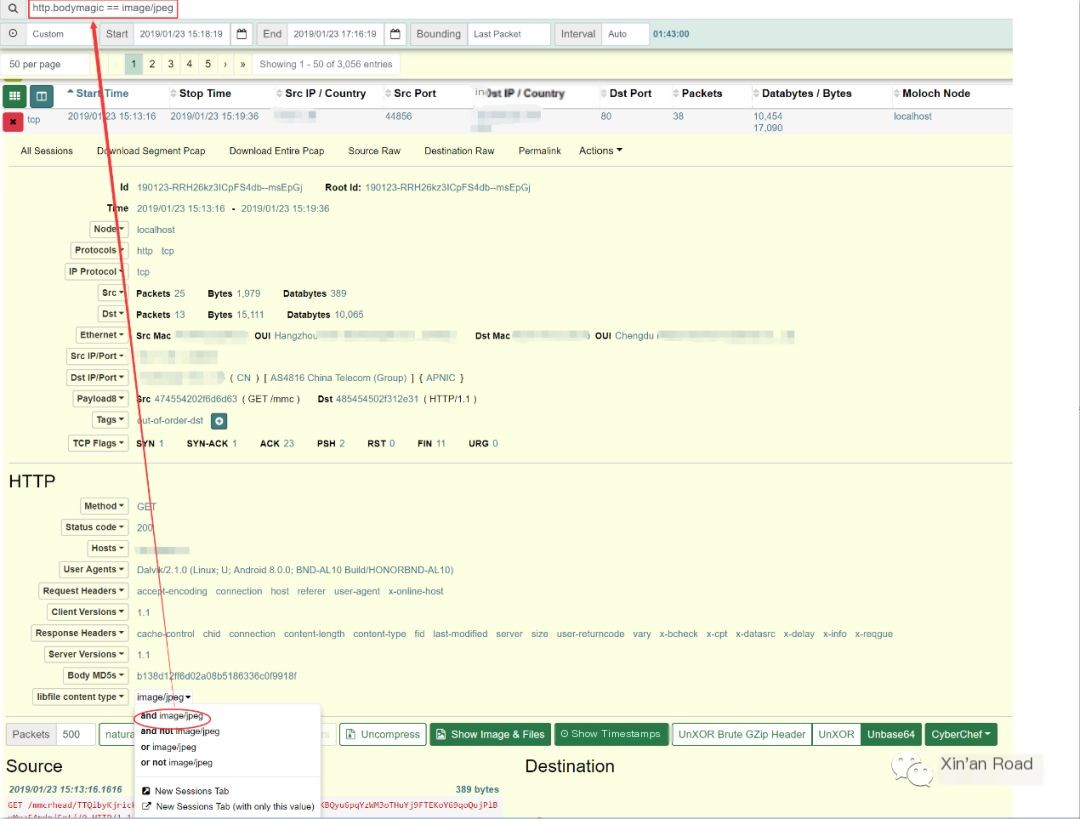
Additionally, by using Export Unique Method to see other supported types, corresponding filter statements can be constructed.
2. SPIView Interface
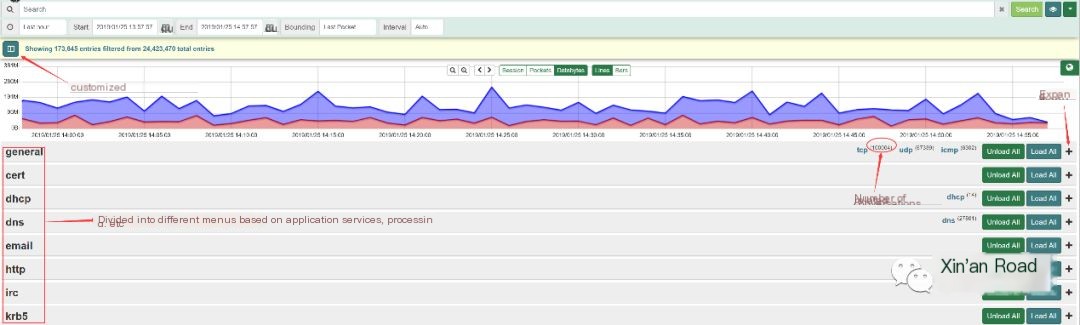
As shown below, clicking “Load All” will expand the menu and load all related field information. Clicking “Unload All” closes the load. (Field names and field values other operations already introduced in the “Data Information” section, so not explained again here)
Example: How to configure the field information you want to view?
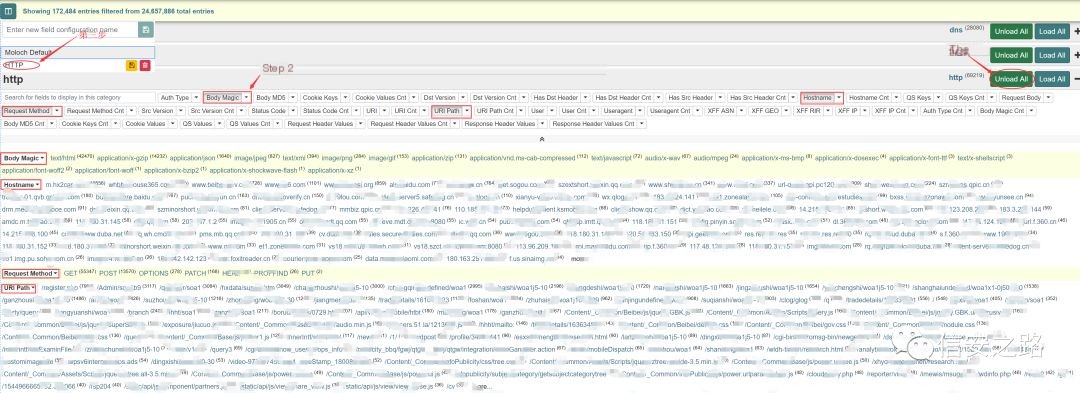
Step 1: Click “Unload All” to not load any fields
Step 2: Click to select the field information you want to view
Step 3: Enter the configuration name and save, completing the configuration
Powerful analysis that can construct various filter statements!
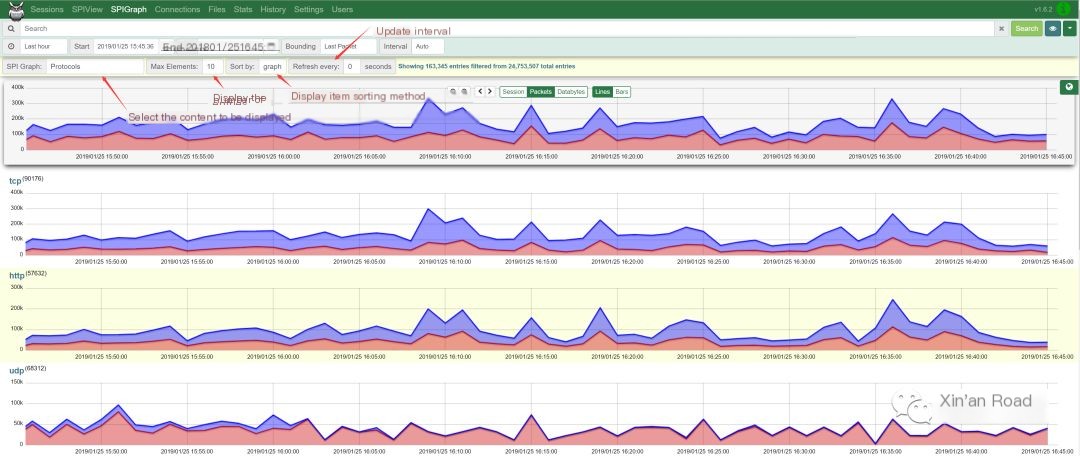
3. SPIGraph
The SPIGraph interface will display the traffic situation of specified fields in the form of a traffic trend graph. In addition to choosing fields directly in the SPIGraph interface, you can also specify which fields to view in the Sessions and SPIView interfaces, and then jump to this interface through the SPIGraph option.
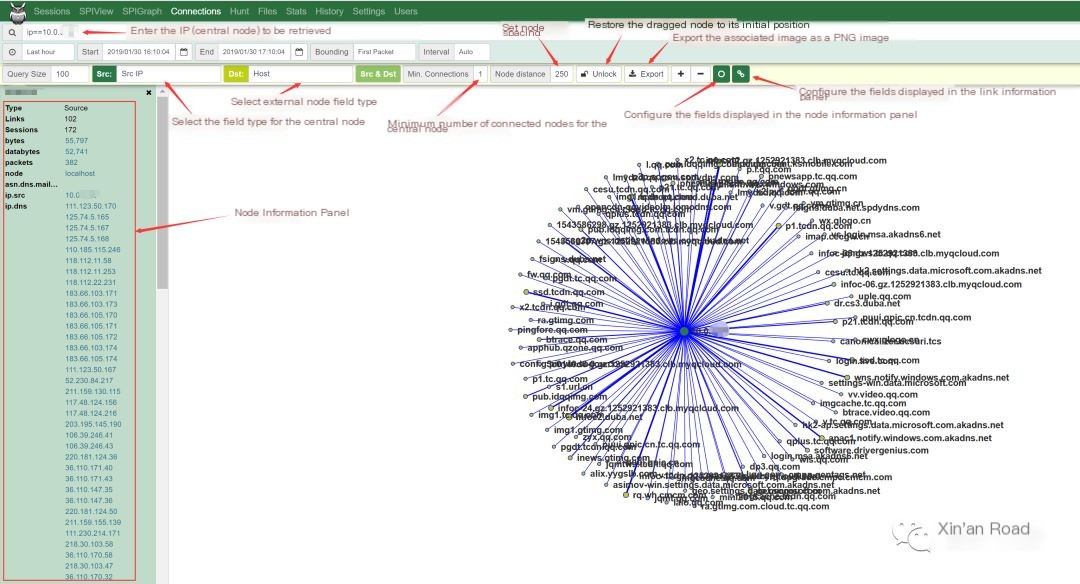
4. Connections Interface
The Connections interface provides an intuitive view of the relationship between source nodes and destination nodes.
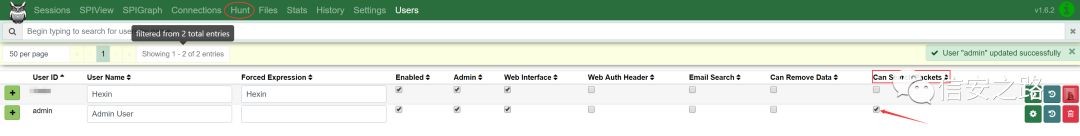
5. Hunt Interface
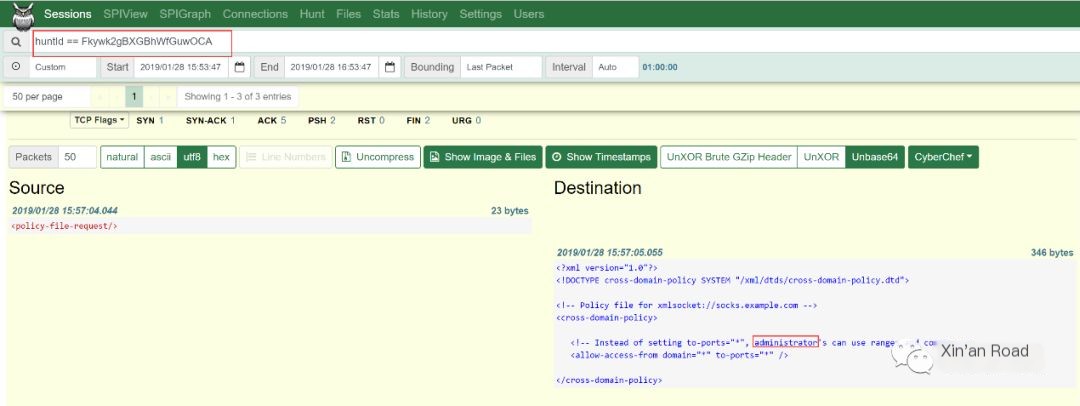
In the Hunt interface, sessions containing specified content can be captured.
By default, the Hunt feature is not enabled. It can be enabled in the Users interface by checking “Can Search Packets” for specified users.
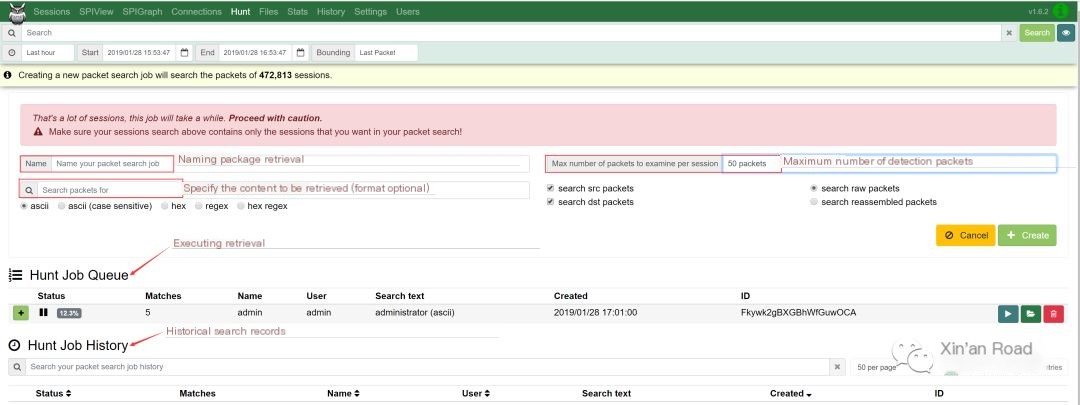
After retrieving data, you can click the folder icon shown in the image below to view the search results.
Example: Search for sessions containing the string “administrator”.
① Configure search entry, conduct search

② View capture results
Advantages:
It can set data stream characteristic values (supporting ASCII, HEX, regular expressions) for monitoring.
Disadvantages:
When defining capture rules, Name does not support Chinese characters;
Only one capture rule can be activated at a time (executed one by one in order, and it will report an error if the capture rule is stopped and restarted);
Only the content of data packets can be matched, and capture rules cannot be set based on packet size (such as fixed-length heartbeat packets that are difficult to detect).
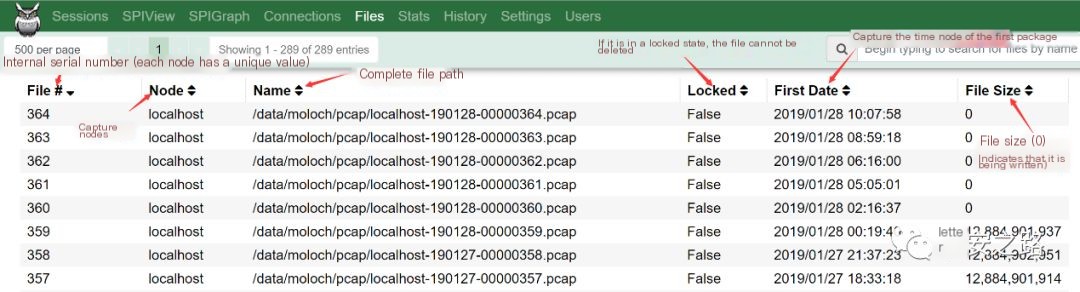
6. Files Interface
The Files page shows the captured pcap. Detailed descriptions of each field are shown below:
7. Stats Interface
The Stats interface provides Moloch status information, which is greatly helpful in Moloch maintenance and troubleshooting.
Note: Because Moloch is based on the Elasticsearch engine and involves data processing, clusters, etc., my understanding is limited, so I will only provide a brief illustration of the interface content below.
Attached Elasticsearch learning links:
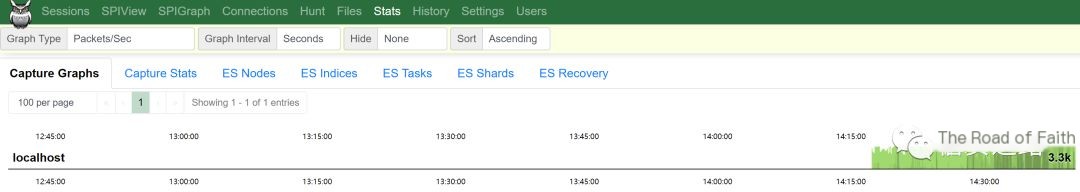
Capture Graphs
The Capture Graphs tab shows the number of sessions currently captured in real-time by the network card. (Its actual usage method is unclear. The page description mentions adjusting the browser’s pixel width to 1500+ when in use…)
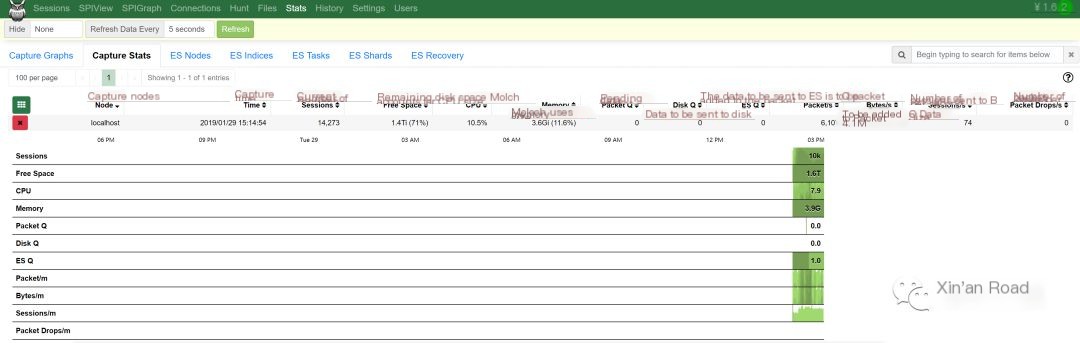
Capture Stats
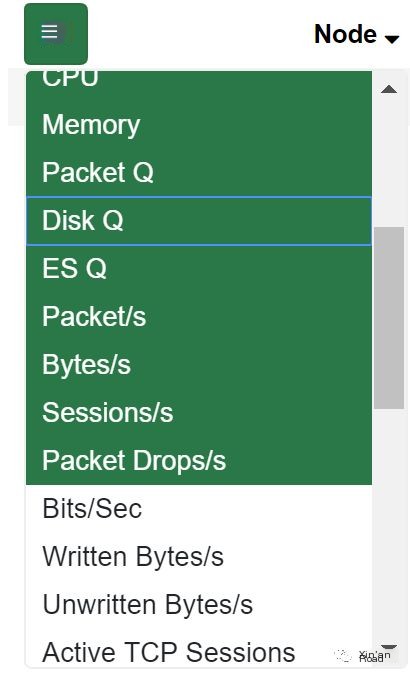
The Capture Stats tab provides detailed information about the current capture node. You can choose fields to display on this page through the column configuration dropdown box, as explained in the following default information.
 JavaScript codeCopy
Description of fields:Node: Capture nodeTime: Capture timeSeesions: Number of sessions currently monitoredFree Space: Remaining disk spaceCPU: CPU size used by MolochMemory: Memory size used by MolochPacket Q: Data packets waiting to be processedDisk Q: Data packets waiting to be sent to diskES Q: Data packets waiting to be sent to ESPacket/s: Data packets to be added to Packet QBytes/s: Size of data packets to be added to Packet QSessions/s: Number of sessions sent to ES per secondPacket Drops/s: Number of packet drops per secondBits/Sec: Same as Bytes/s, but changed from bytes/second to bits/secondWritten Bytes/s: Size of all data packets written to disk by MolochUnwritten Bytes/s: Size of all data packets not written to disk by MolochActive TCP Sessions: Number of TCP sessions being monitoredActive UDP Sessions: Number of UDP sessions being monitoredActive ICMP Sessions: Number of ICMP sessions being monitoredActive SCTP Sessions: Number of SCTP sessions being monitoredActive ESP Sessions: Number of ESP sessions being monitoredUsed Space: Size of used diskES Health Response MS: ES health status responseClosing Q: Number of closed sessionsAwaiting Q: Number of sessions waiting to be writtenActive Fragments: Number of active ES shardsFragments Dropped/Sec: Number of fragments dropped per secondTotal Dropped/Sec: Total number of fragments dropped per secondES Session Bytes/Sec: Byte size of ES sessions per secondOverload Drops/s: UnknownES Drops/s: UnknownES Session Size/Sec: Size of ES sessions per secondES Nodes
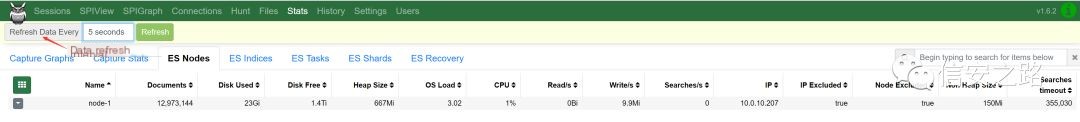
The ES Nodes tab provides ES node information. You can choose fields to display on this page through the column configuration dropdown box.
 JavaScript codeCopy
Description of fields:Name: Index nameDocuments: Documents in the indexDisk Used: Size of used diskDisk Free: Remaining disk spaceHeap Size: Heap size (unknown)OS Load: System load (unknown)CPU: Percentage of CPU usedRead/s: Read rateWrite/s: Write rateSearches/s: Query rateIP: IP corresponding to the nodeIP Excluded: UnknownNode Excluded: UnknownNon Heap Size: Size remaining after excluding the heap (unknown)Searches timeout: Search intervalES Indices
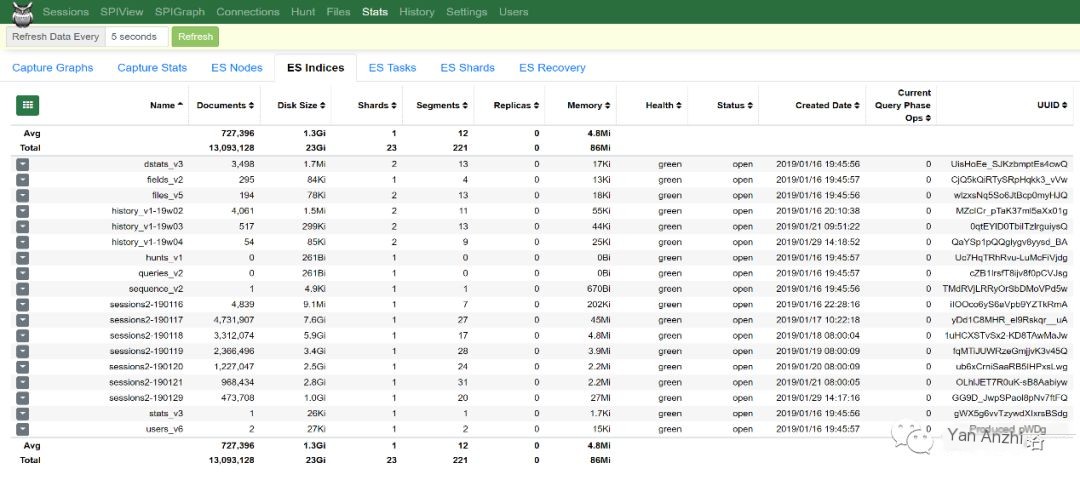
The ES Indices tab provides ES index information. You can choose fields to display on this page through the column configuration dropdown box.
 JavaScript codeCopy
Description of fields:Name: Index nameDocuments: Number of documents in the indexDisk Size: Storage occupied by the indexShards: Number of ES shardsSegments: ES segmentsReplicas: Backup shardsMemory: Memory occupied by the indexHealth: Index health status (Green is the healthiest, Yellow indicates basic shard availability, Red indicates partial shard availability)Status: Index status (open/closed)Created Date: Index creation dateCurrent Query Phase Ops: Current query phase (unknown)UUID: Internal UUID of the indexES Tasks
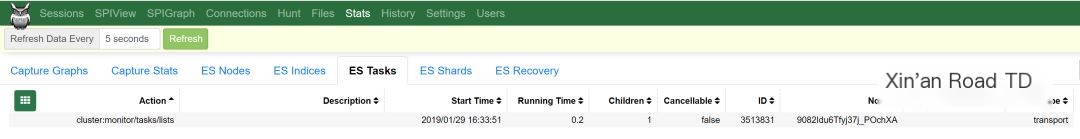
The ES Tasks tab provides ES task information. You can choose fields to display on this page through the column configuration dropdown box.
 JavaScript codeCopy
Description of fields:Action: BehaviorDescription: Description of the behavior being executedStart Time: Task start timeChildren: Related subtasksCancellable: Whether it can be canceledID: ID (unknown)Node: NodeTask ID: Task IDType: Task typeES Shards
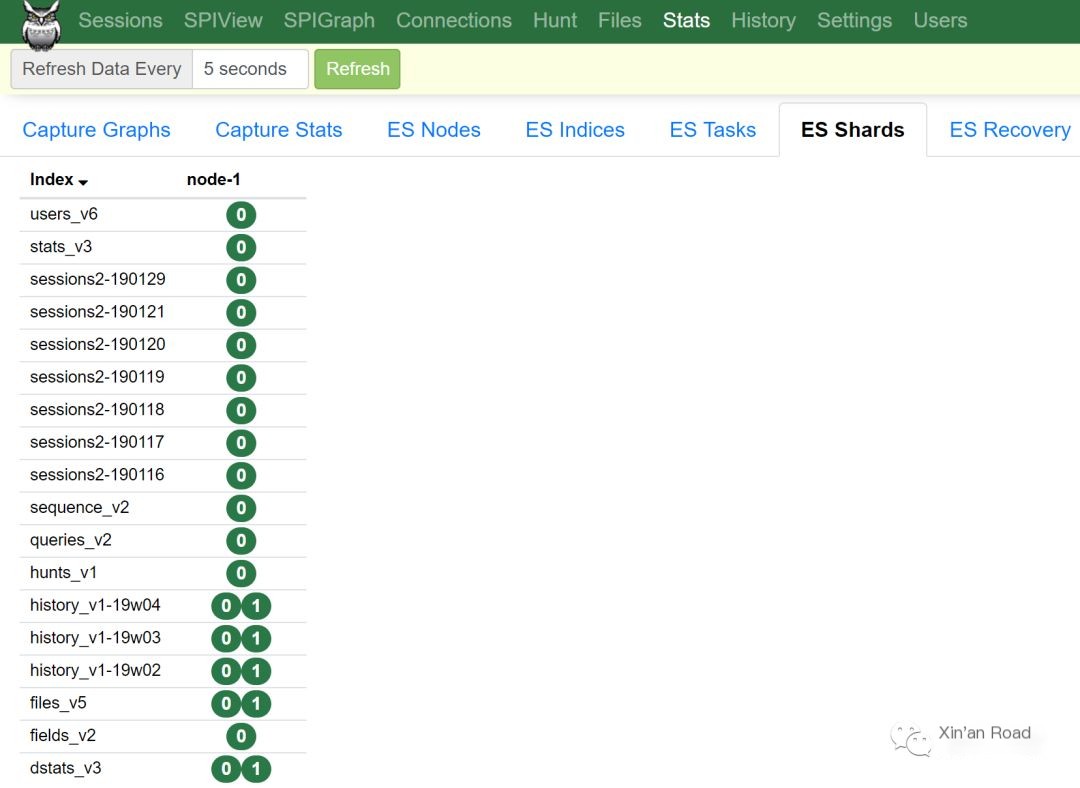
The ES Shards tab provides the correspondence between index and node shards.
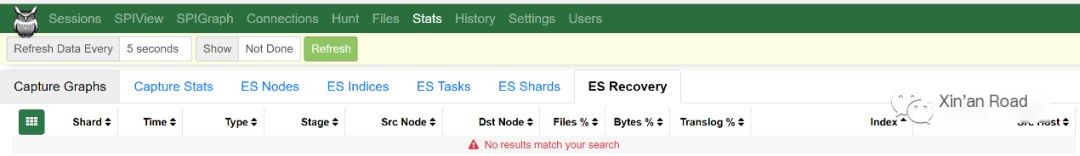
ES Recovery
The ES Recovery tab provides ES task information (Recovery refers to the process of assigning an unallocated shard of an index to a node.). You can choose fields to display on this page through the column configuration dropdown box.
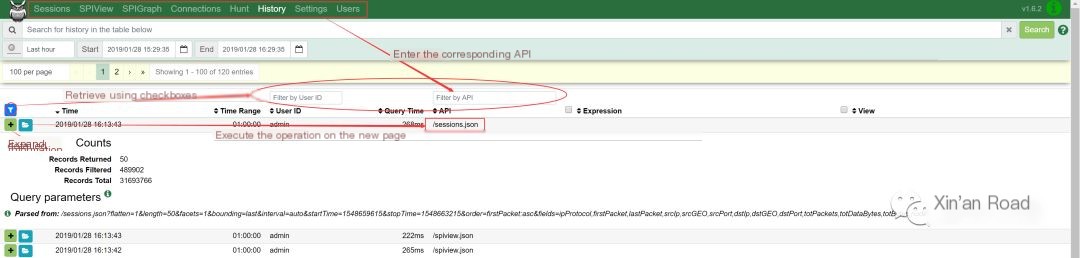
8. History
The History interface allows viewing of user historical operations and supports playback of historical operations.
Note: Regular users can only view their operations, while administrators can view operations of all users
9. Settings Interface
The Settings interface allows configuration of various information for the current logged-in account, specifics are as follows:
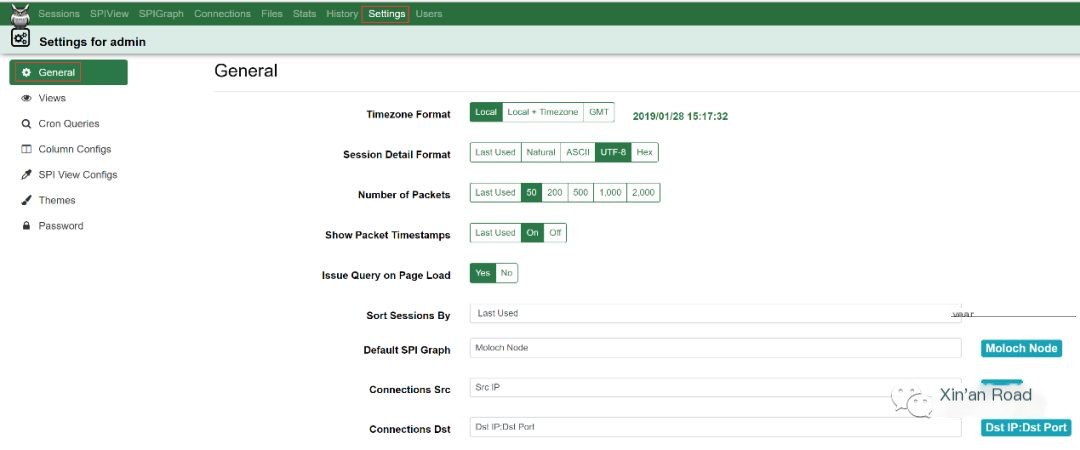
General
As shown in Figure 9-1, general information settings can be made for Moloch.
Timezone Format: Set timezone format
Session Detail Format: Default session packet parsing format
Number of Packets: Default number of returned packets
Show Packet Timestamps: Show/Hide packet timestamps
Issue Query on Page Load: Whether to query upon page load
Sort Sessions By: Default session sorting
Default SPI Graph: Default field for SPI graph
Connections Src: Default source field
Connections Dst: Default destination field
Views
Users can add, update, or delete filtering rules in this interface (specific usage already explained in the Sessions section).
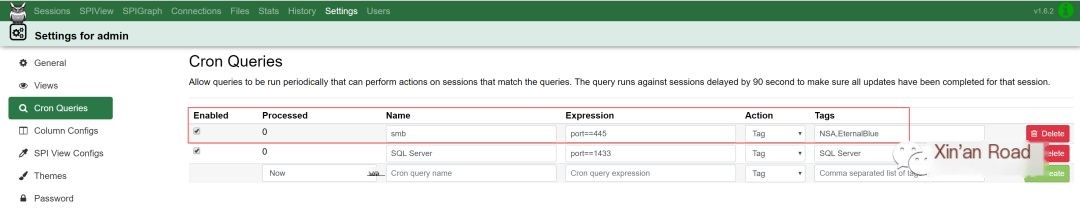
Cron Queries
Set scheduled tasks to execute defined filter statements on the Sessions interface at regular intervals (there is a 90-second delay relative to the session to ensure the session is fully transmitted).
Column Configs
Configure the column information displayed on the Sessions page (specific usage already explained in the Sessions section).
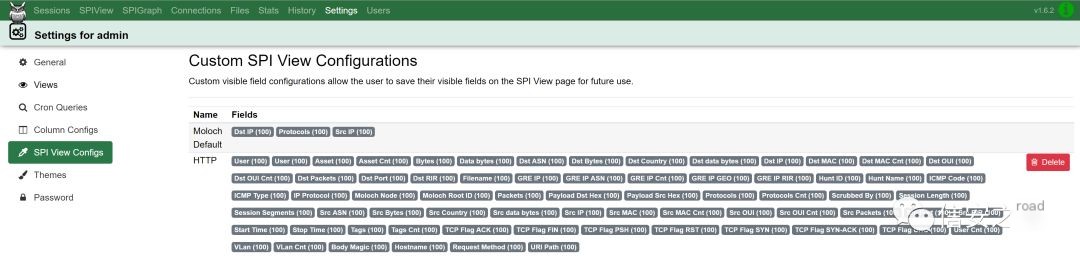
SPI View Configs
Configure fields for search in the SPI View interface (specific usage already explained in the SPI View section).
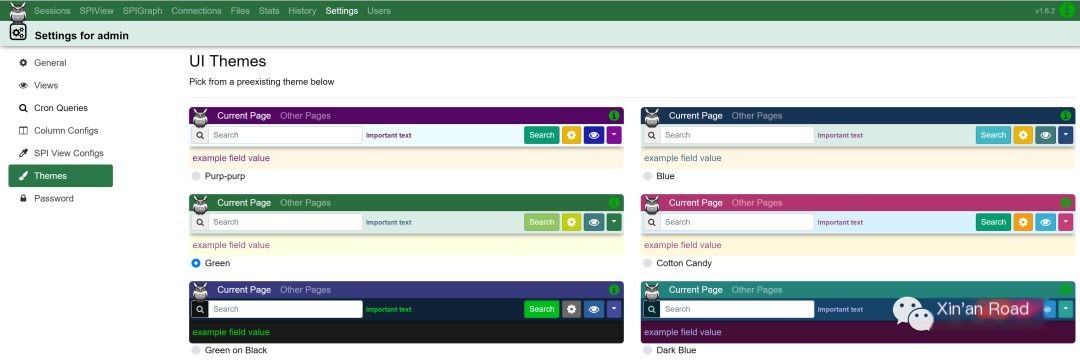
Themes
Users can choose their preferred color scheme.
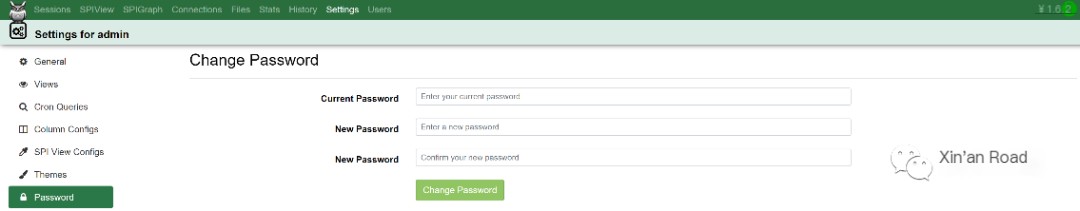
Password
10. Users Interface
The Users page is responsible for user management. You can add or delete users and can also restrict the permissions of existing users.
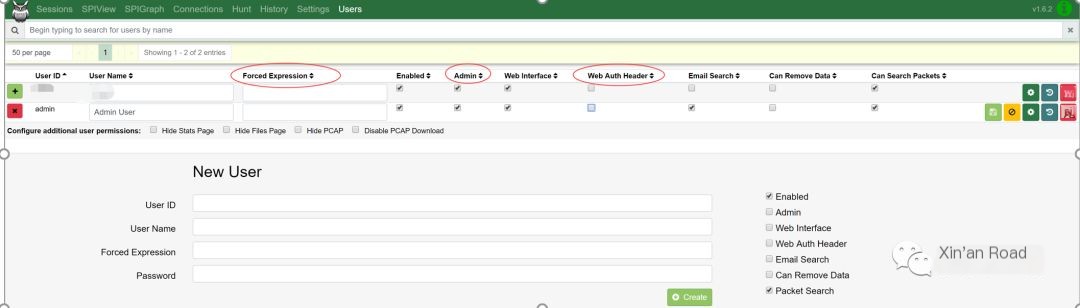
The following three options are mainly explained:
Forced Expression: Default filter conditions for the current user. (If protocols==tcp is set, the user can only query tcp data)
Admin: Whether to grant administrator rights to the current user (i.e., has permission to add, delete, and modify)
Web Auth Header: Login does not require a password, only needs authentication based on the Web header