

This series of articles will systematically organize and delve into system security, reverse engineering, and malware detection. The articles will be more focused, systematic, and in-depth, representing the author’s gradual journey of growth. A long march forward, heading bravely into the fray. Enjoy the process—let’s keep pushing forward together!
The previous text attempted a software source analysis, combining common methodologies for identifying APT attacks, using Python to call extension packages for tracing, but there are limitations. This article will share the basic usage of Procmon software, as well as file and process, and registry viewing. Procmon is a highly recommended system monitoring tool by Microsoft, with powerful features that can be used to detect malware. This is a foundational article, hoping to be of assistance to you~
As a newcomer to web security, the author shares some self-study basic tutorials with everyone, primarily focusing on online notes about security tools and practical operations. I hope you like them. Moreover, I hope you can work and progress with me, as I plan to further study web security and system security knowledge and share related experiments. In short, I hope this series of articles is helpful to fellow bloggers. Writing isn’t easy; experts, please be gentle with your critiques. Thank you!

一. Process Monitor
1. Basic Introduction
Process Monitor is a system monitoring tool recommended by Microsoft. It is an advanced tool capable of displaying real-time file system, registry (read and write), network connection, and process activities. It integrates the legacy Sysinternals tools, Filemon and Regmon, where Filemon is specifically used to monitor any file operation processes in the system, and Regmon is used to monitor the registry read and write operations.
- Filemon: File Monitor
- Regmon: Registry Monitor
Simultaneously, Process Monitor has added monitoring items such as process ID, user, and process reliability, all of which can be recorded to a file. Its powerful capabilities are sufficient to make Process Monitor a core component of your system and a tool for virus detection.
Process Monitor can assist users in monitoring and recording any file or registry operations within the system. By observing changes in registry and file read/write activities, it effectively aids in diagnosing system malfunctions or detecting malware, viruses, and trojans.
GitHub download link:
- https://github.com/eastmountyxz/Security-Software-Based
2. Use Cases
Running Process Monitor is recommended in administrator mode. Once you start Process Monitor, it begins monitoring three types of operations: file system, registry, and processes.
- File System
Process Monitor displays all Windows file system activities, including local disks and remote file systems. It automatically detects new file system devices and monitors them. All system paths are displayed relative to file system operations executed within the user’s session. To clear file system operations from the list, deselect the “File System” button on the Process Monitor toolbar, then press it again to increase monitoring of the file system. - Registry
Process Monitor logs all registry operations and displays the registry paths using common registry root key abbreviations (e.g., HKEY_LOCAL_MACHINE abbreviated as HKLM). To clear registry operations from the list, uncheck the “Registry” button on the Process Monitor toolbar; pressing it again will restore the monitoring of the registry. - Process
In the Process/Thread monitoring subsystem of Process Monitor, it tracks all creation and exit operations of processes/threads, including the loading of DLLs and device drivers. To clear process actions from the list, deselect the “Processes” button in the Process Monitor toolbar. Pressing it again can increase monitoring of processes. - Network
Process Monitor uses “Windows Event Tracing (ETW)” to track and record TCP and UDP activities. Each network operation includes the source address and destination address, along with the amount of data sent and received, but does not include the actual data. To clear network operations from the list, deselect the “Network” button on the Process Monitor toolbar. Pressing it again will enable network monitoring.
- Performance Analysis
This event class can be enabled in the “Options” menu. When set to “Enabled,” Process Monitor scans all active threads in the system and generates a performance analysis event for each thread. This event logs the CPU time consumed in both kernel mode and user mode, along with numerous context switches executed by the thread since the last performance analysis event.
Section II. Analyzing Executable Files with Procmon
1. Common usage
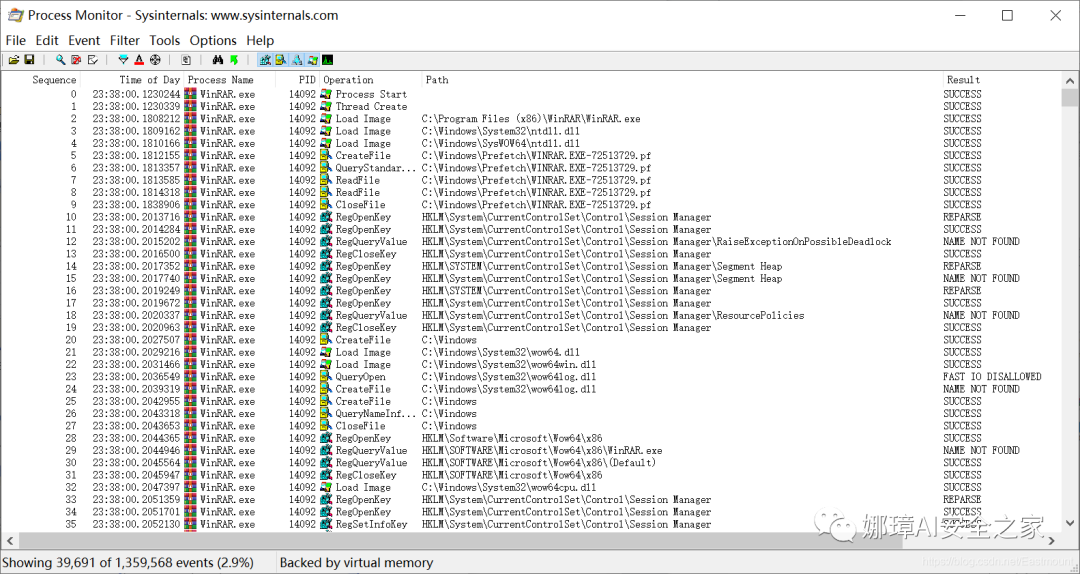
After downloading the Procmon.exe software, simply double-click to launch it. Procmon will automatically scan and analyze the current running status of system programs. The four frequently used buttons outlined in the image are for the following purposes: capture toggle, clear screen, set filter criteria, and find. The last five aligned buttons are used to configure which types of events to capture, representing the read/write operations for the registry, read/write operations for files, network connections, process and thread activities, and configuration events. Typically, the first two are selected, which are registry and file operations.
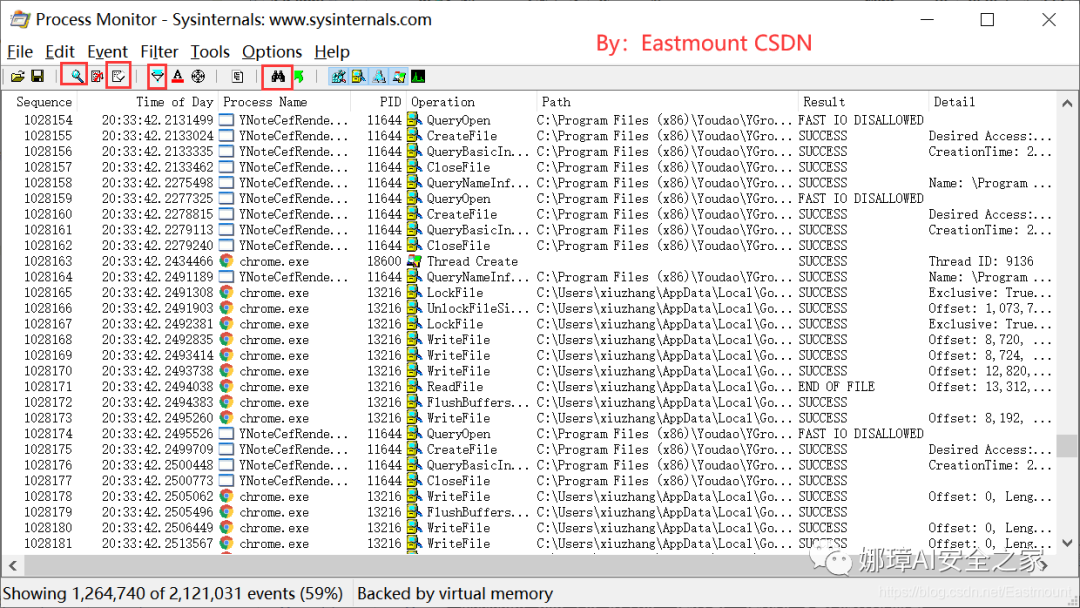
The output includes sequence number, timestamp, process name, PID, operation, path, result, description, etc. Common monitoring items usually include:
- File Systems
- Registry
- Process: Track the creation and termination of all processes and threads.
- Dissecting the Event: Scan all active threads in the system and create a profiling event for each thread. Record the amount of core and user CPU time it has consumed, as well as the number of context switches the thread has executed since the last profiling event.
To better customize your selections, you can configure them in the filter (as seen in the image above) or choose the Select Columns option in the Options menu. You can then customize the display of columns through the column selection dialog that appears. Common column selections include:
- Application Details
– Process Name: The name of the process that generates the event
– Image Path: The full path of the process image
– Command Line: The command line used to start the process
– Company Name: The company name in the process image file. This text is defined by the application’s developer
– Description: The product description information in the process image file. This text is defined by the application’s developer
– Version: The product version number in the process image file. This text is defined by the application’s developer - Event Details
– Sequence Number: The relative position of an operation within the entirety of events, also including the current filter.
– Event Class: The category of the event (file, registry, process).
– Operation: Specific event operation, such as Read, RegQueryValue, etc.
– Date & Time: The date and time of the operation.
– Time of Day: Only the time of the operation.
– Path: The path of a resource that an event references.
– Detail: Additional information about the event.
– Result: The status code of a completed operation.
– Relative Time: The time an operation occurs relative to the start of Process Monitor or relative to when Process Monitor’s information was cleared.
– Duration: The amount of time a completed operation took. Process Management
– User Name: The user account name of the process performing the operation
– Session ID: The Windows session ID of the process performing the operation
– Authentication ID: The login session ID of the process performing the operation
– Process ID: The process ID of the process that executed the operation
– Thread ID: The thread ID of the thread that executed the operation
– Integrity Level: The trust level of the process when performing the operation (supported only on Vista and later systems)
– Virtualized: The virtualization state of the process that executed the operation
2. Case Study Analysis
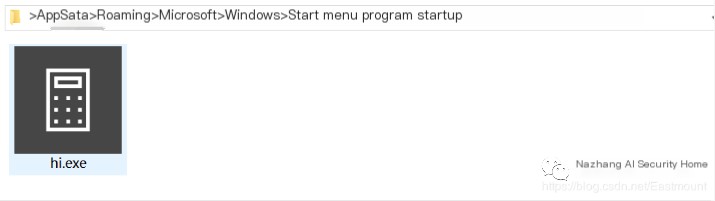
Below, we will analyze the startup autolaunch of a particular program, “hi.exe.” Note that in the author’s previous article, the 36th CVE vulnerability reproduction article, “hi.exe” was maliciously loaded into the startup directory. Here, we analyze it.
C:\Users\xxxx\AppData\Roaming\Microsoft\Windows\Start Menu\Programs\Startup
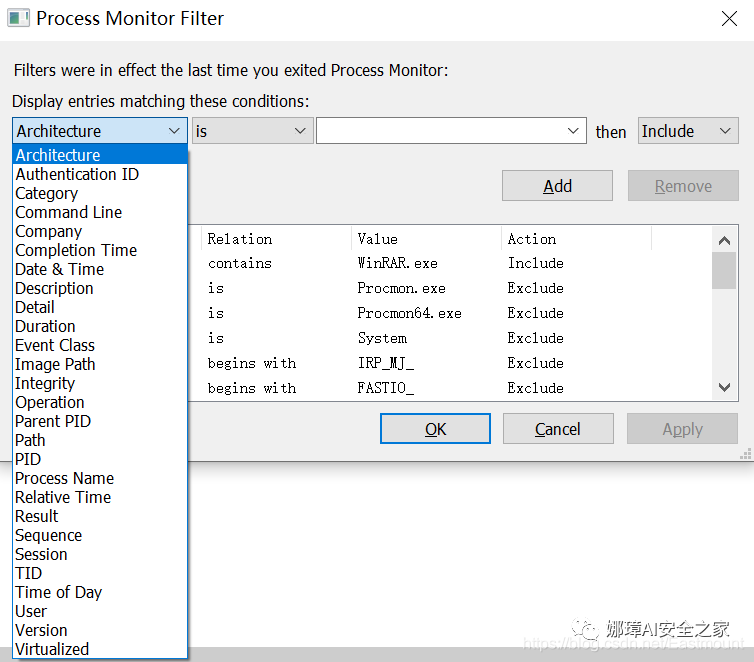
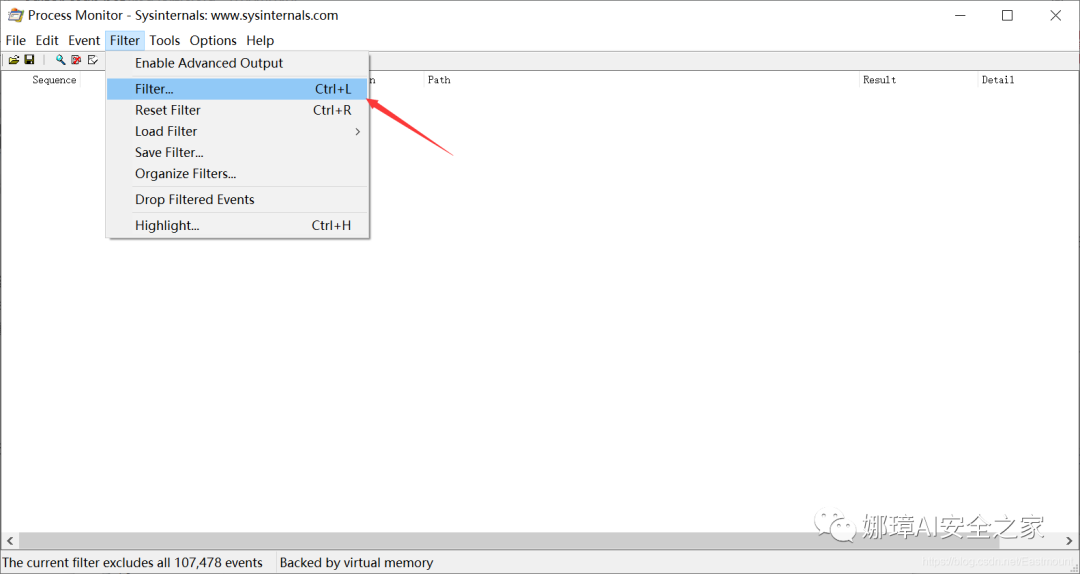
Step one, set up the filter.
Open the software Process Monitor, and click on filter->filter.
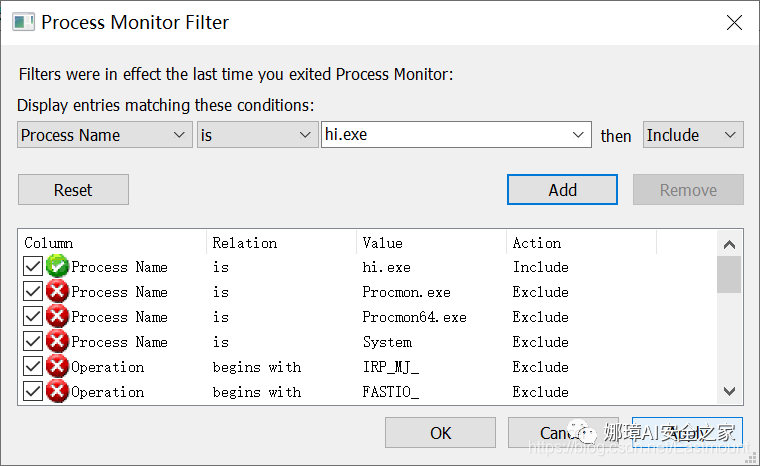
In the pop-up dialog, select under the Architecture dropdown, fill in the application name you want to analyze for Process Name, click Add to add it, and finally click Apply in the bottom right corner.
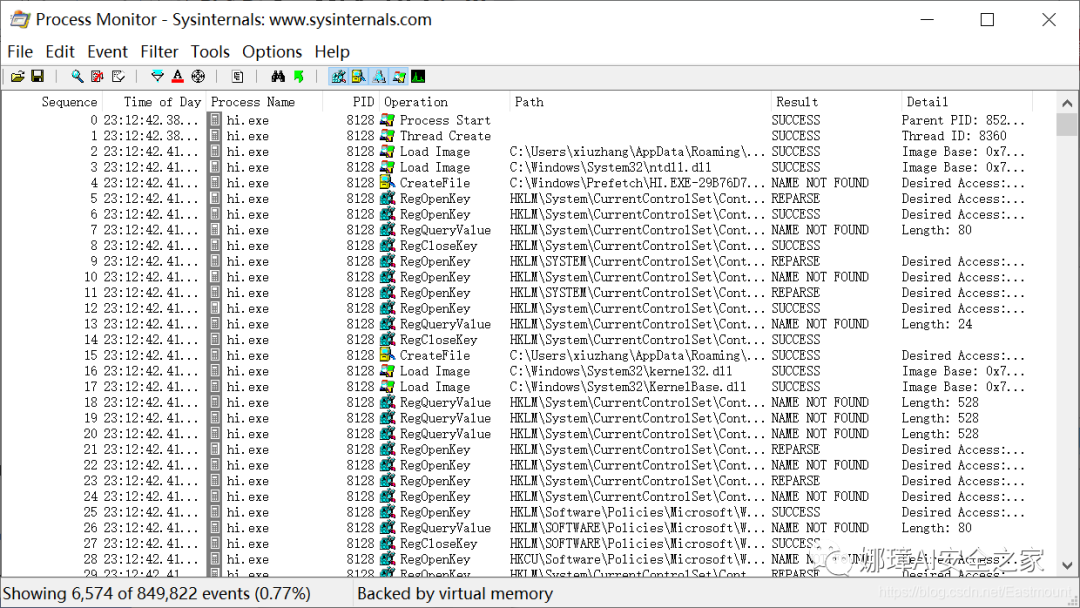
Step two, execute the application under analysis.
Double-clicking the application will bring up the “Calculator.”

You can see that Process Monitor tracks the application’s behavior.
Step three, check the location of the executable file.
Click the search button and then enter “CreateFile”.
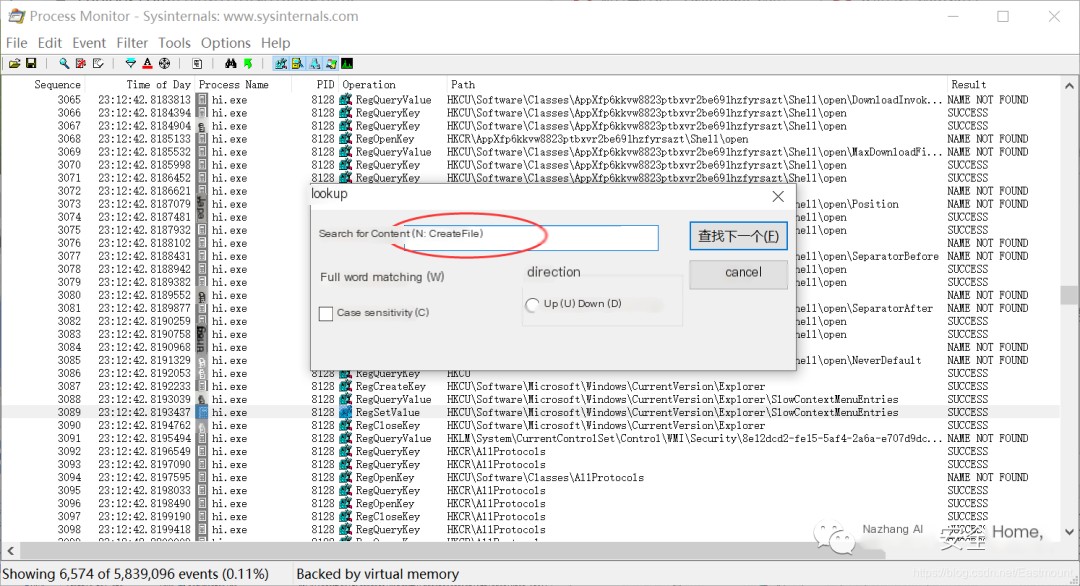
After locating the option, we right-click on “Jump To”.
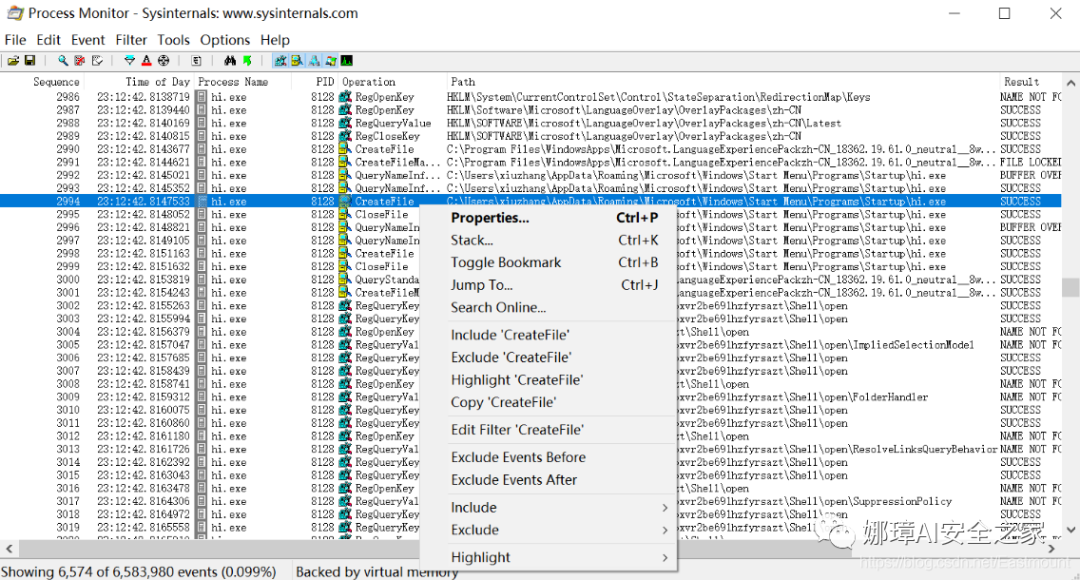
We can navigate to the folder where the file is located, namely:
Win 7/10:
C:\Users\xxxx\AppData\Roaming\Microsoft\Windows\Start Menu\Programs\StartupWin XP:
C:\Documents and Settings\Administrator\Start Menu\Programs\Startup

Step Four: Examine Registry Settings.
Search for the file “RegSetValue”.
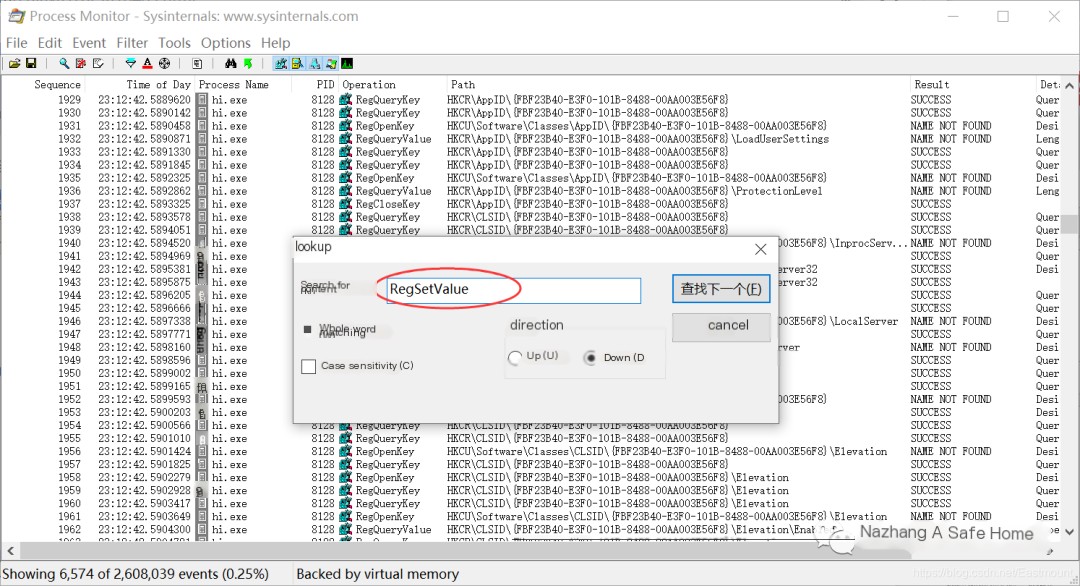
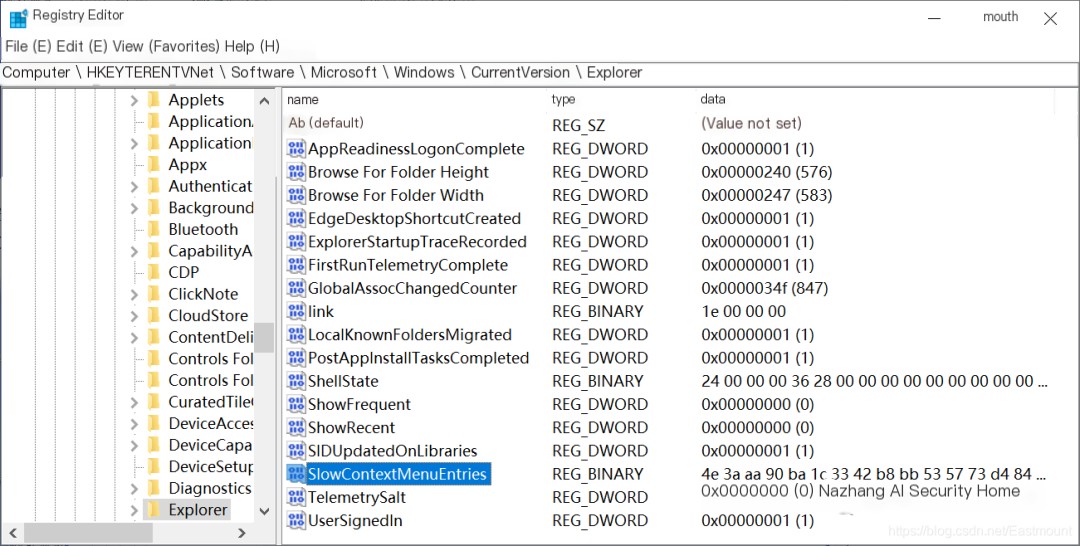
Right-click to select “jump to” and navigate to the registry.
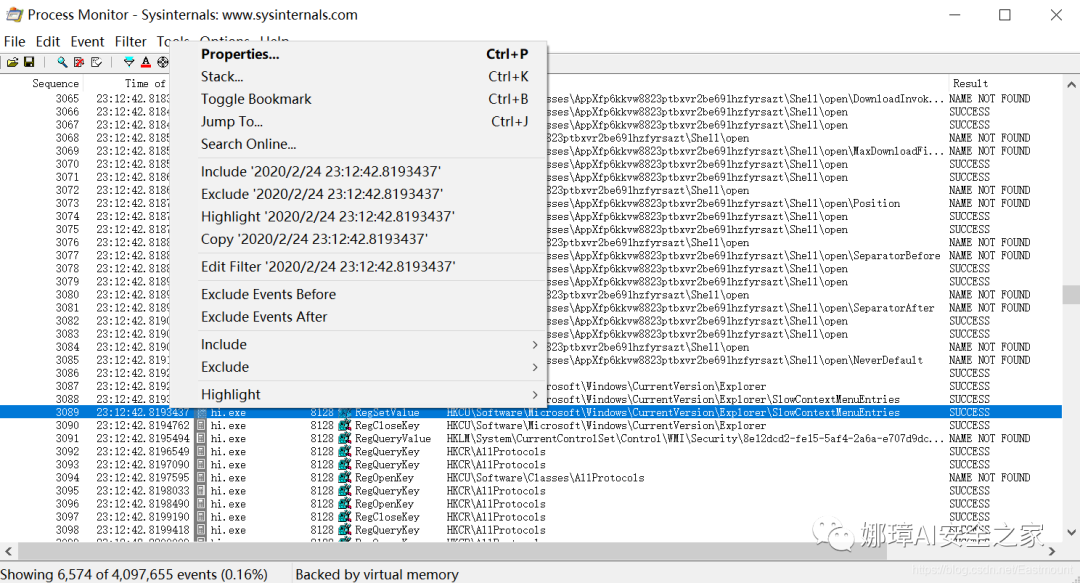
You can view the contents of the registry, and if there’s an auto-start, you can also see the related key-value settings.
Programs that automatically restart on Windows can be registered in any of the following registry locations.
- HKEY_CURRENT_USER\Software\Microsoft\Windows\CurrentVersion\Run
- HKEY_CURRENT_USER\Software\Microsoft\Windows\CurrentVersion\RunOnce
- HKEY_LOCAL_MACHINE\Software\Microsoft\Windows\CurrentVersion\Run
- HKEY_LOCAL_MACHINE\Software\Microsoft\Windows\CurrentVersion\RunOnce
Three. Promon Analysis Archive
Next, we analyze the compressed package.
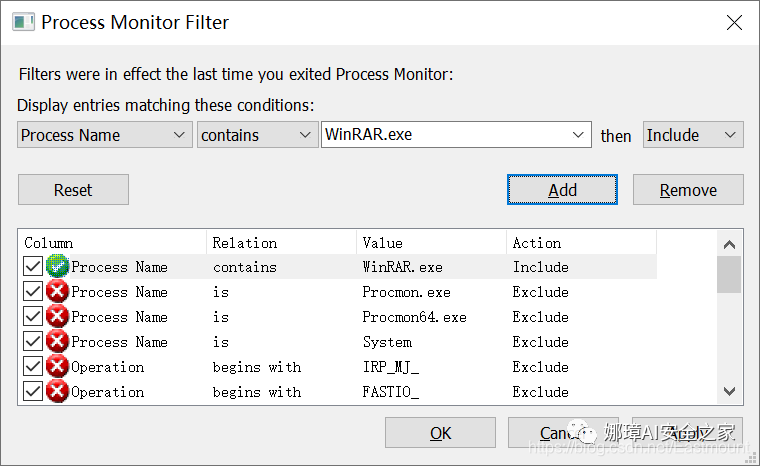
First step, configure the filter.
Open the software Process Monitor, and click on filter -> filter. In the dialog box that appears, select Process Name under the Architecture dropdown, and enter the name of the application you wish to analyze, click Add to add it, and Apply to implement it. Note that you can also add other filtering rules.
Step two, open the compressed file and a specific document.
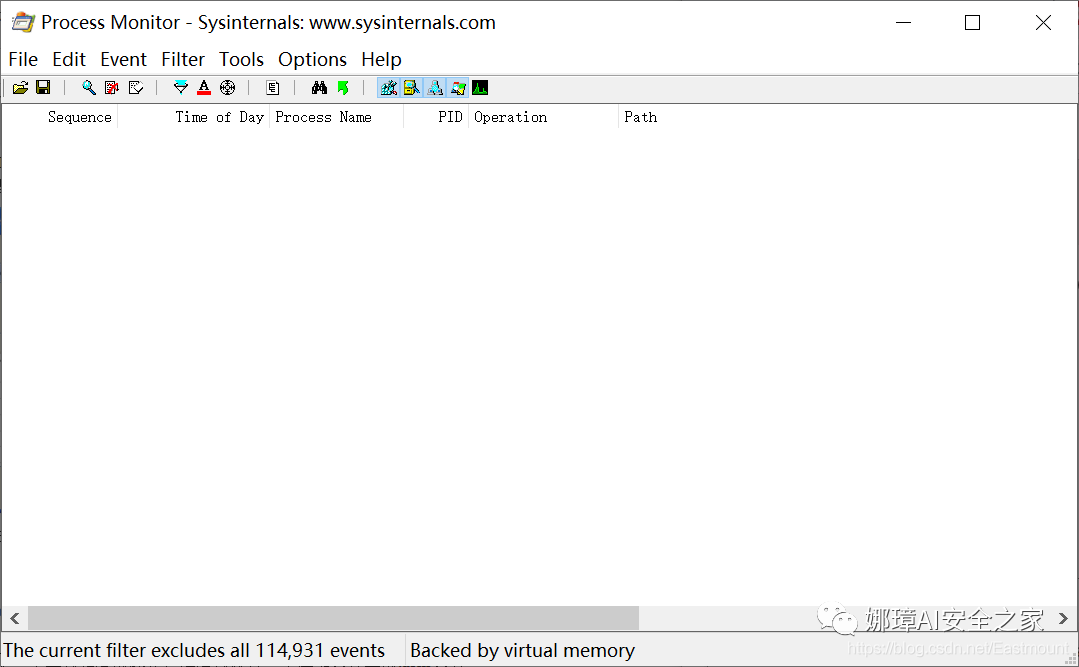
The results, before opening the compressed file, are shown in the image below:
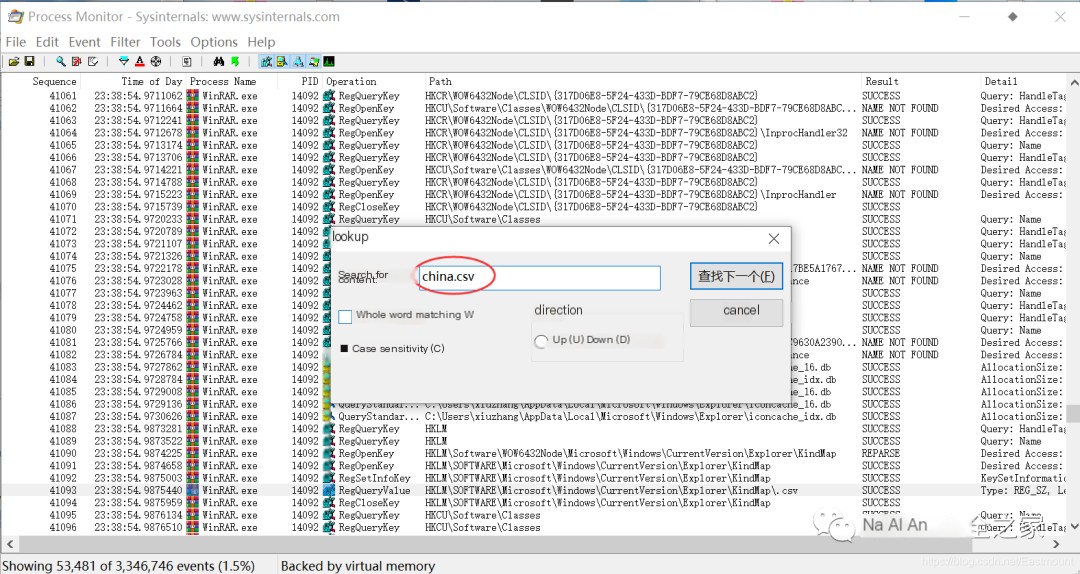
Open the file “2020-02-22-china.csv” from the zip package. This is the open-source code for the author’s Python big data analysis on the Wuhan epidemic, and it is recommended for readers who are interested to read it.
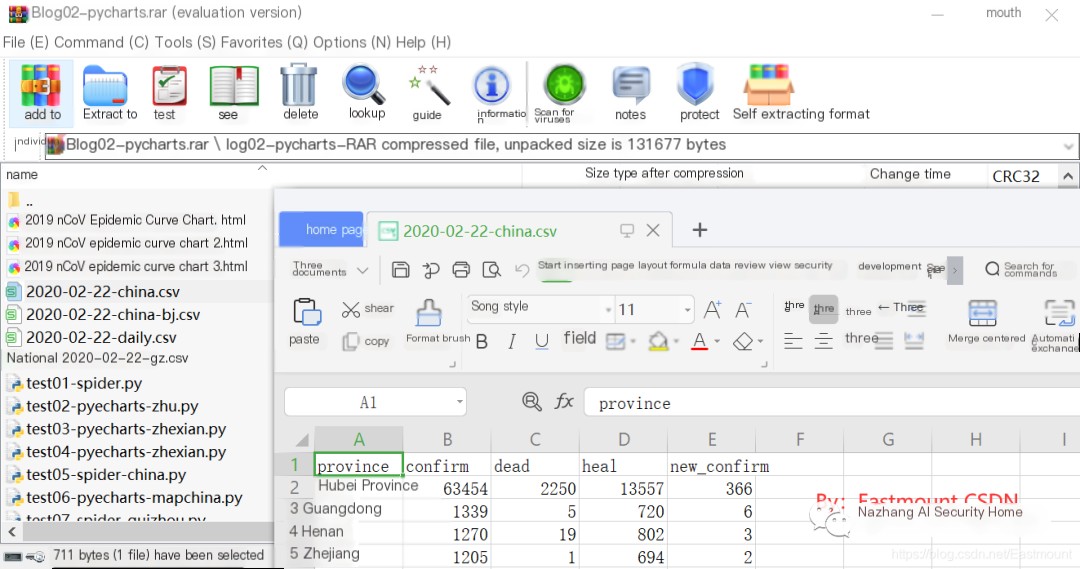
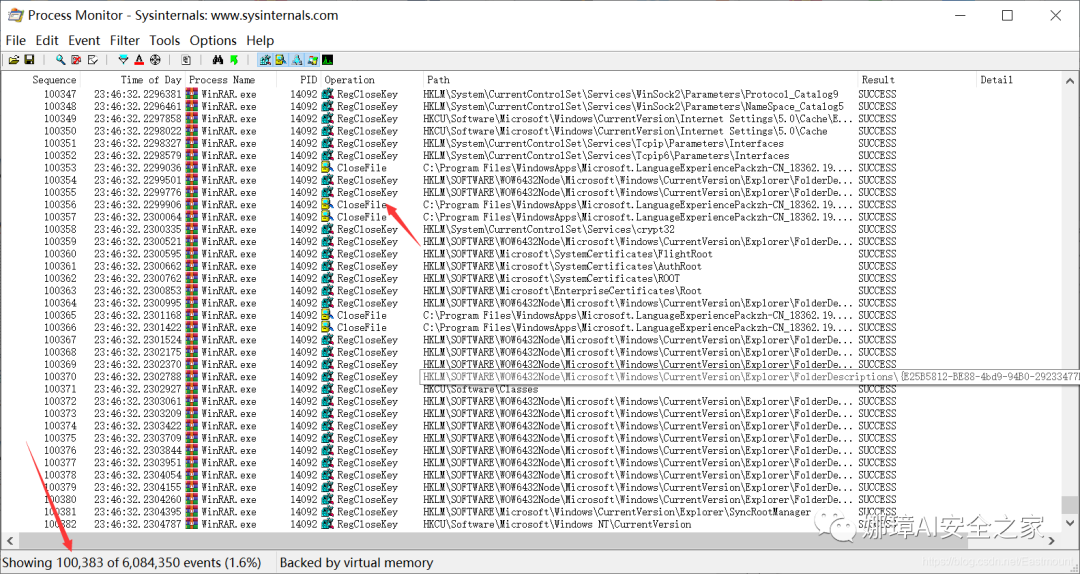
Procmon displays operations related to WinRAR, as shown in the image below. We can view information on running processes, registry entries, and more.
Step Three: Query files related to “china.csv”.
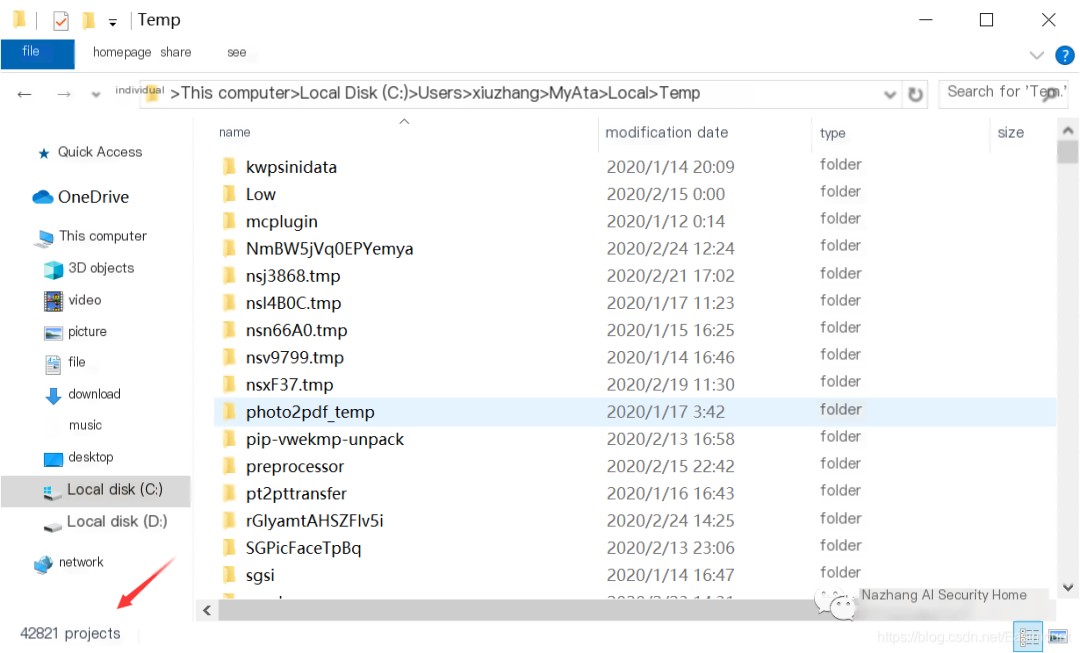
The path to the temporary files can be seen as:
C:\Users\xxxx\AppData\Local\Temp\Rar$DIa14092.24700
Step Four, right-click on “Jump To” to navigate and view the files.
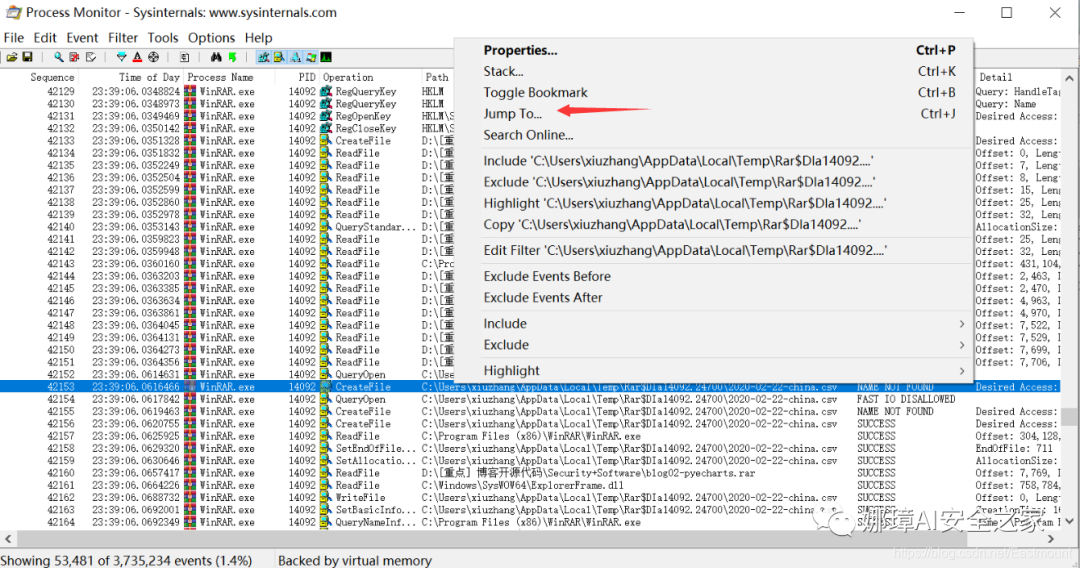
Tracking this directory, I found this file in the corresponding directory on the C drive. Upon opening it, the content was the same as the originally opened file.
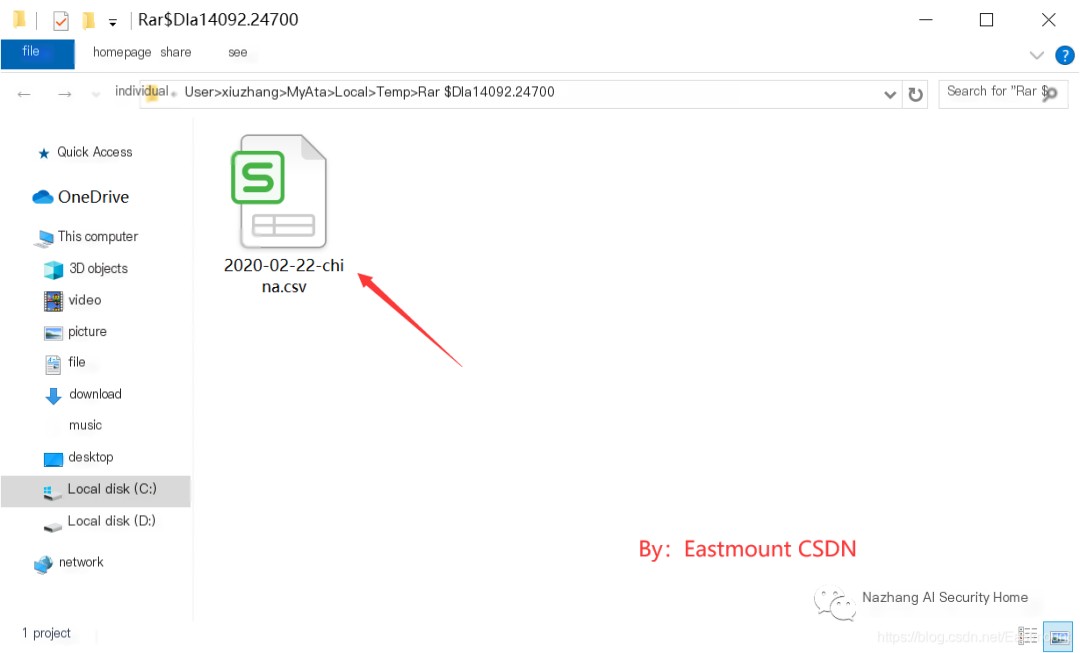
AppData\Local\Temp
This is a temporary storage folder in Windows systems that retains websites you’ve visited or other records here. If you revisit the same address, the computer can retrieve files faster, and it may even allow viewing without a network connection. This is not secure, as your confidential files could also be stored in this location. It is recommended to delete these files regularly.
Step five, after directly opening a file within the WinRAR archive, there are two ways to close it: first, close the opened file and then the opened archive; the other way is to close the opened archive first, followed by the opened file. It is advisable to use Process Monitor to analyze the differences between these two methods.
The number of files loaded when opening the compressed package is as shown in the figure below.
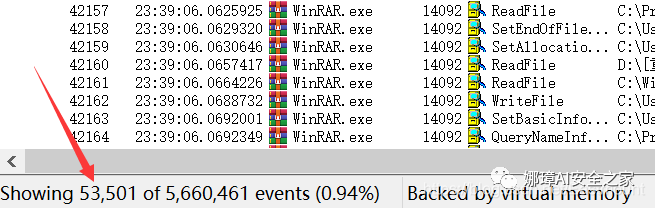
First, close the Word file, and then close WinRAR. Note that after closing the Word file, Process Monitor detected an event; similarly, after closing WinRAR, Process Monitor also detected an event.
This is merely a basic usage article, with the author hoping to share more examples after studying in greater depth. For instance, it might discuss monitoring the creation, modification, deletion, or access operations of files within a specific directory, thereby saving logs as files for future analysis.
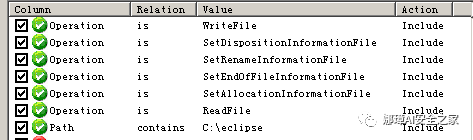
- WriteFile: Write operation, which may generate multiple entries depending on the file size.
- ReadFile: Read operation, a single read will generate many entries.
- SetAllocationInformationFile: Triggered when modifying the file
- SetEndOfFileInformationFile: Triggered when modifying a file.
- SetRenameInformationFile: Triggered During Renaming
- SetDispositionInformationFile: Triggered when a file is deleted
4. Summary
To conclude, this article provides an overview focusing on three main components:
- Introduction to Procmon Software
- Analyzing Executable Files with Procmon
- Procmon analysis of compressed file packages, including processes and registry.
Next, the author will utilize this tool to analyze malicious samples within a virtual machine, covering key knowledge points including:
- File Activity Behavior Analysis: Using Procmon to Monitor Trojan Client File Behavior
- Registry Activity Behavior Analysis: Using Procmon to Monitor Trojan Client Registry Setting Value Behavior
- Network Activity Behavioral Analysis: Monitoring Network Behavior with Wireshark, TCP Three-Way Handshake Connection, Communication Process Between the Controlled and Controlling Ends
I hope this series of articles is helpful to you. I truly feel that my skills are quite basic, and there is so much to learn. From network security to system security, from Trojans to backdoor hijacking, from malicious code to trace analysis, from penetration tools to binary tools, as well as Python security, top conferences, hacking competitions, and vulnerability sharing. To know the offense, you must understand the defense. Life’s journey is long, and as a beginner, I am truly crawling along the way. I am grateful for the help from many people, and I will continue to crawl forward and keep working hard!