

1. Introduction
It is one of the command-line tools installed by default with Wireshark. From its name, it is self-evident that it is primarily used to display the information of packet capture files, such as file format, number of packets, time range (first and last packet), and packet type.
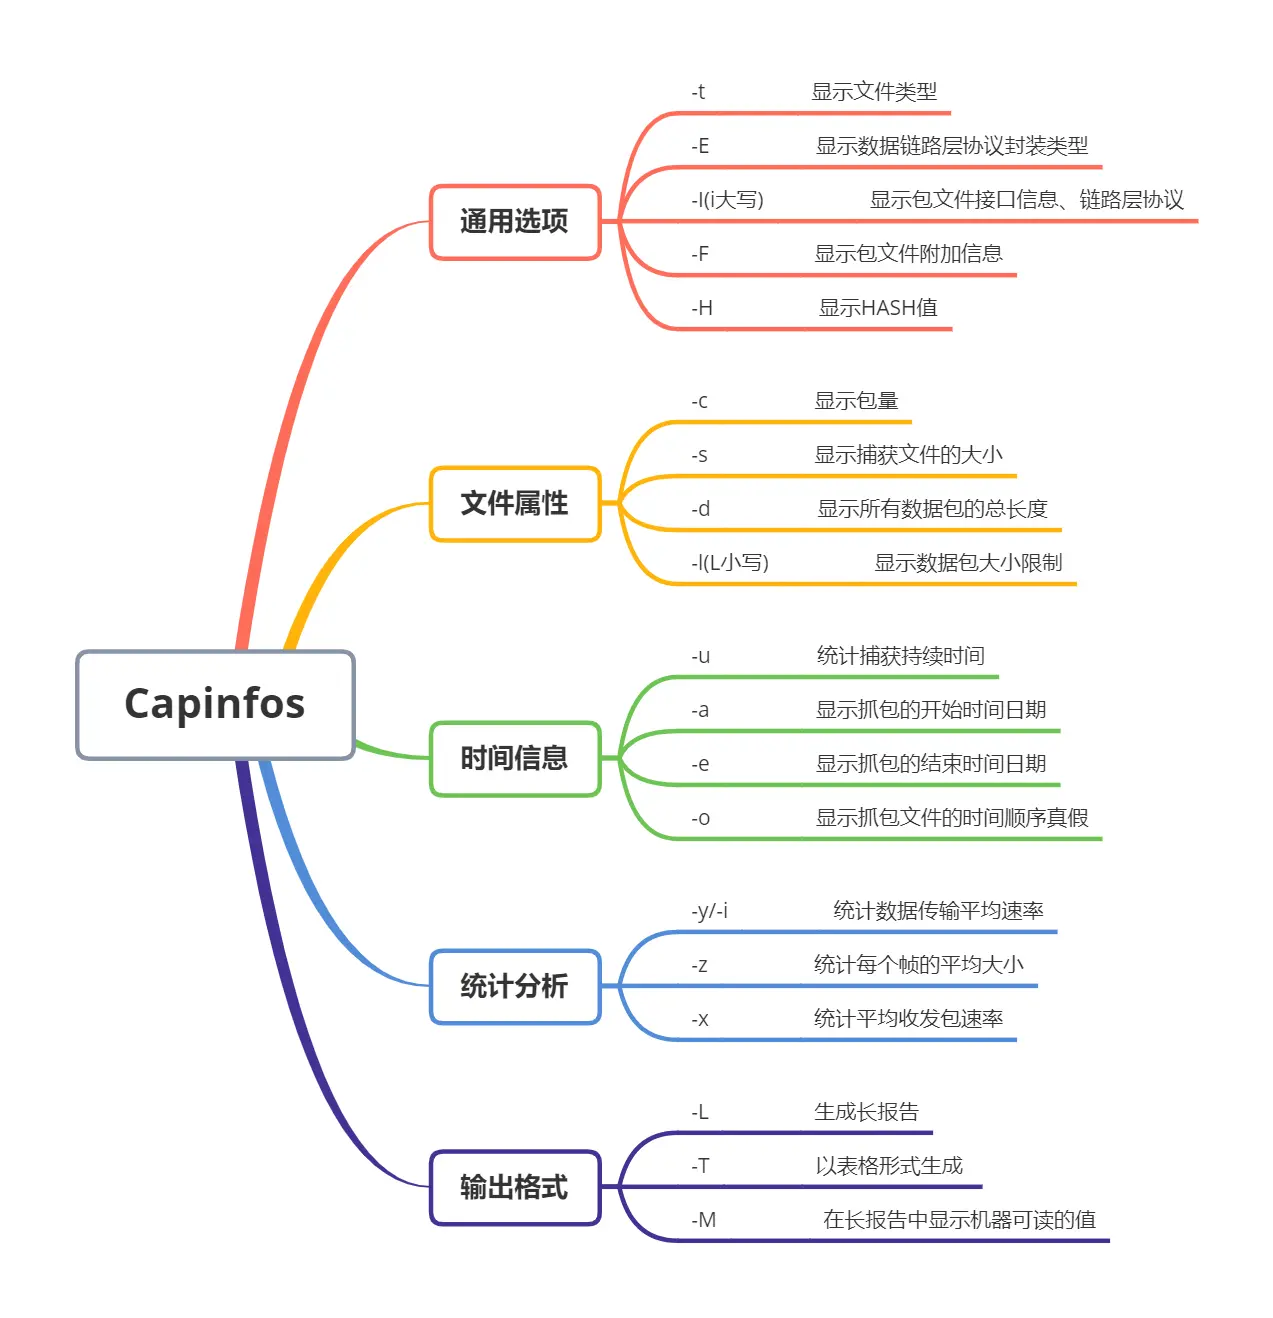
The usage scenarios are roughly as follows:
This article will provide a detailed introduction to usage cases of capinfos.
2. Installation
Linux
| Distribution | Installation Command |
|---|---|
| Archlinux | pacman -Sy wireshark-cli |
| CentOS/Redhat | yum install -y wireshark |
| Debian/Ubuntu | apt install -y wireshark |
| Gentoo | emerge –ask wireshark |
Windows
After installing Wireshark, it is in the default Wireshark installation path:
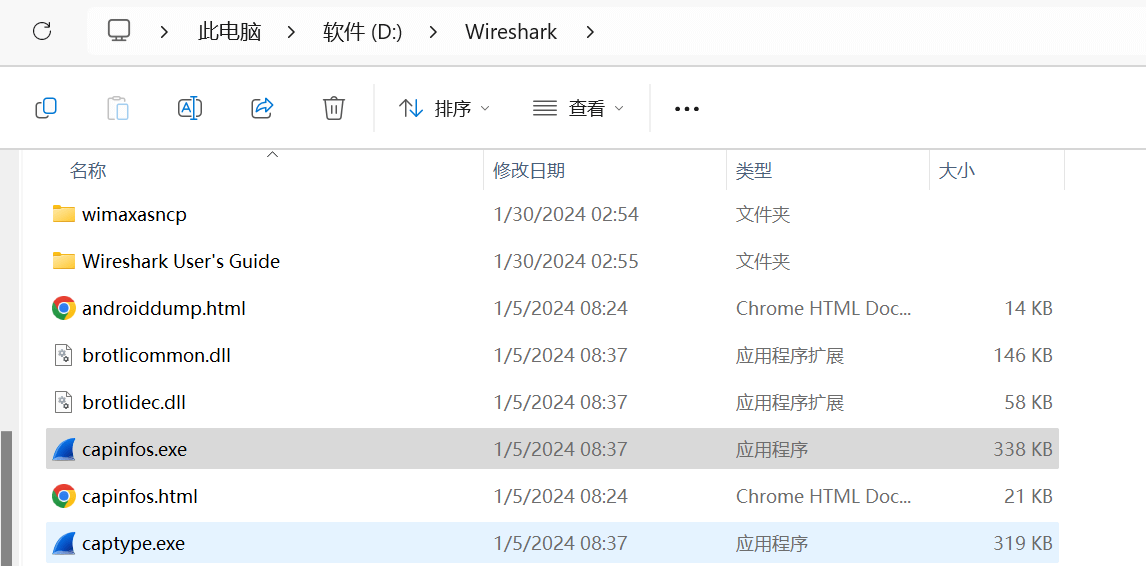
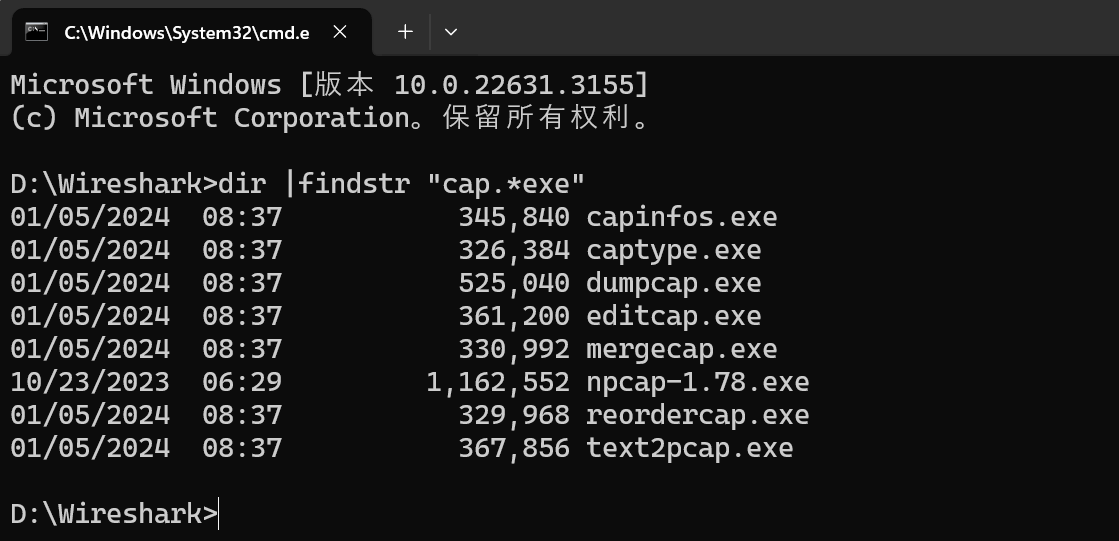
Other accompanying commands are also under this path:
You can choose to add the path to the environment variables or use it directly under the path.
MacOS
Use homebrew to install Wireshark, which will be installed by default:
3. Usage Case Analysis
0. Output All Information
When no parameters are added, it will default to quoting the -A parameter and output all information fields.
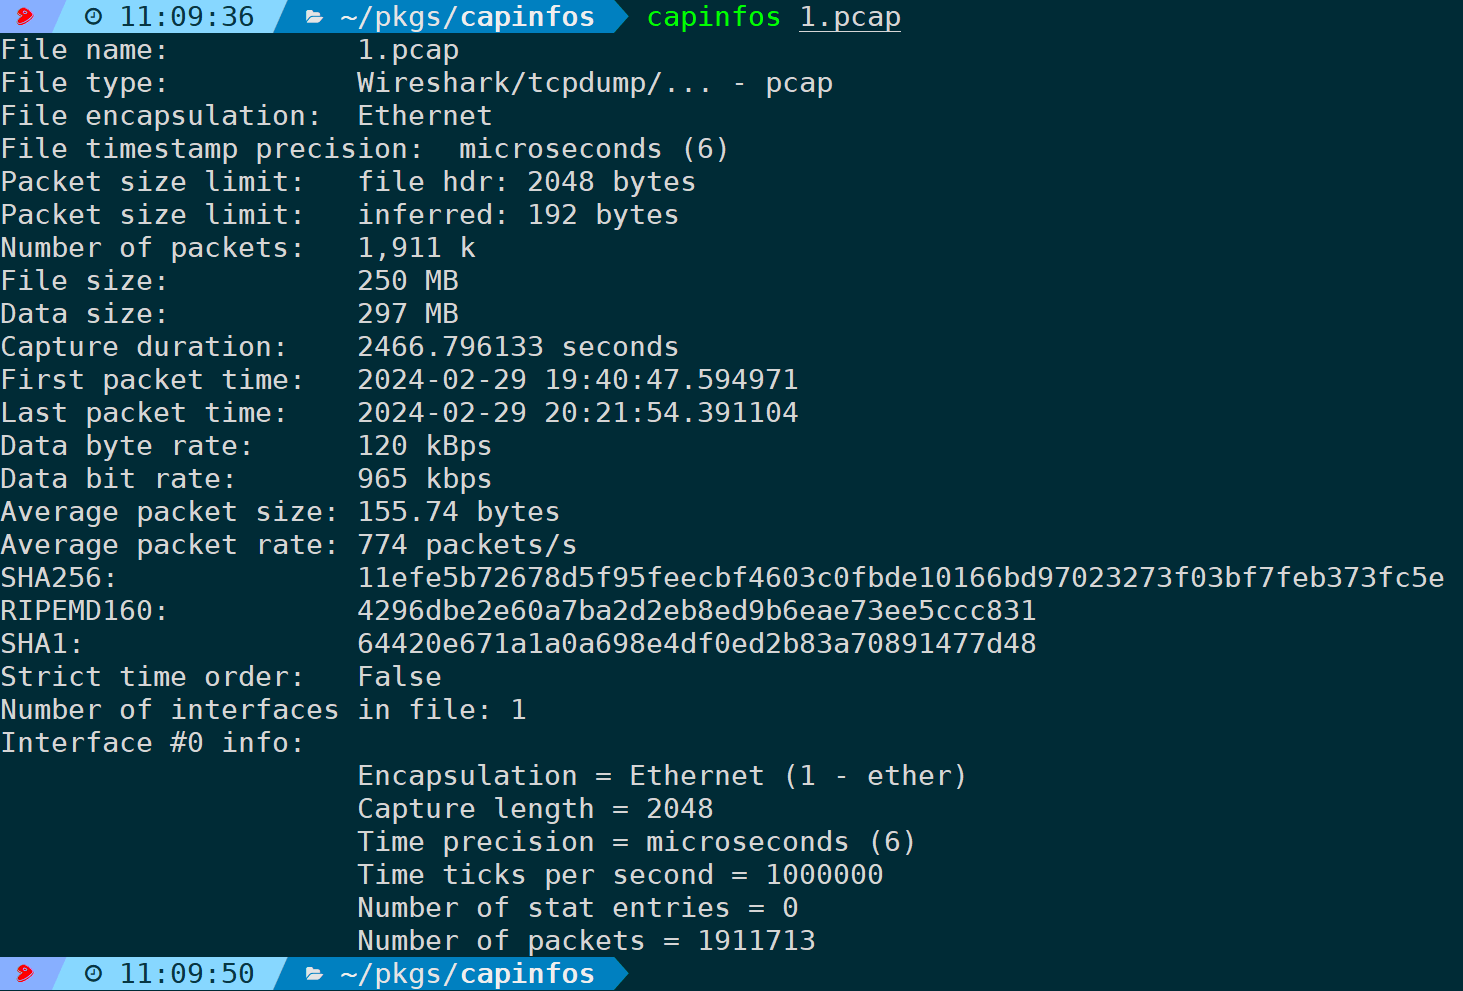
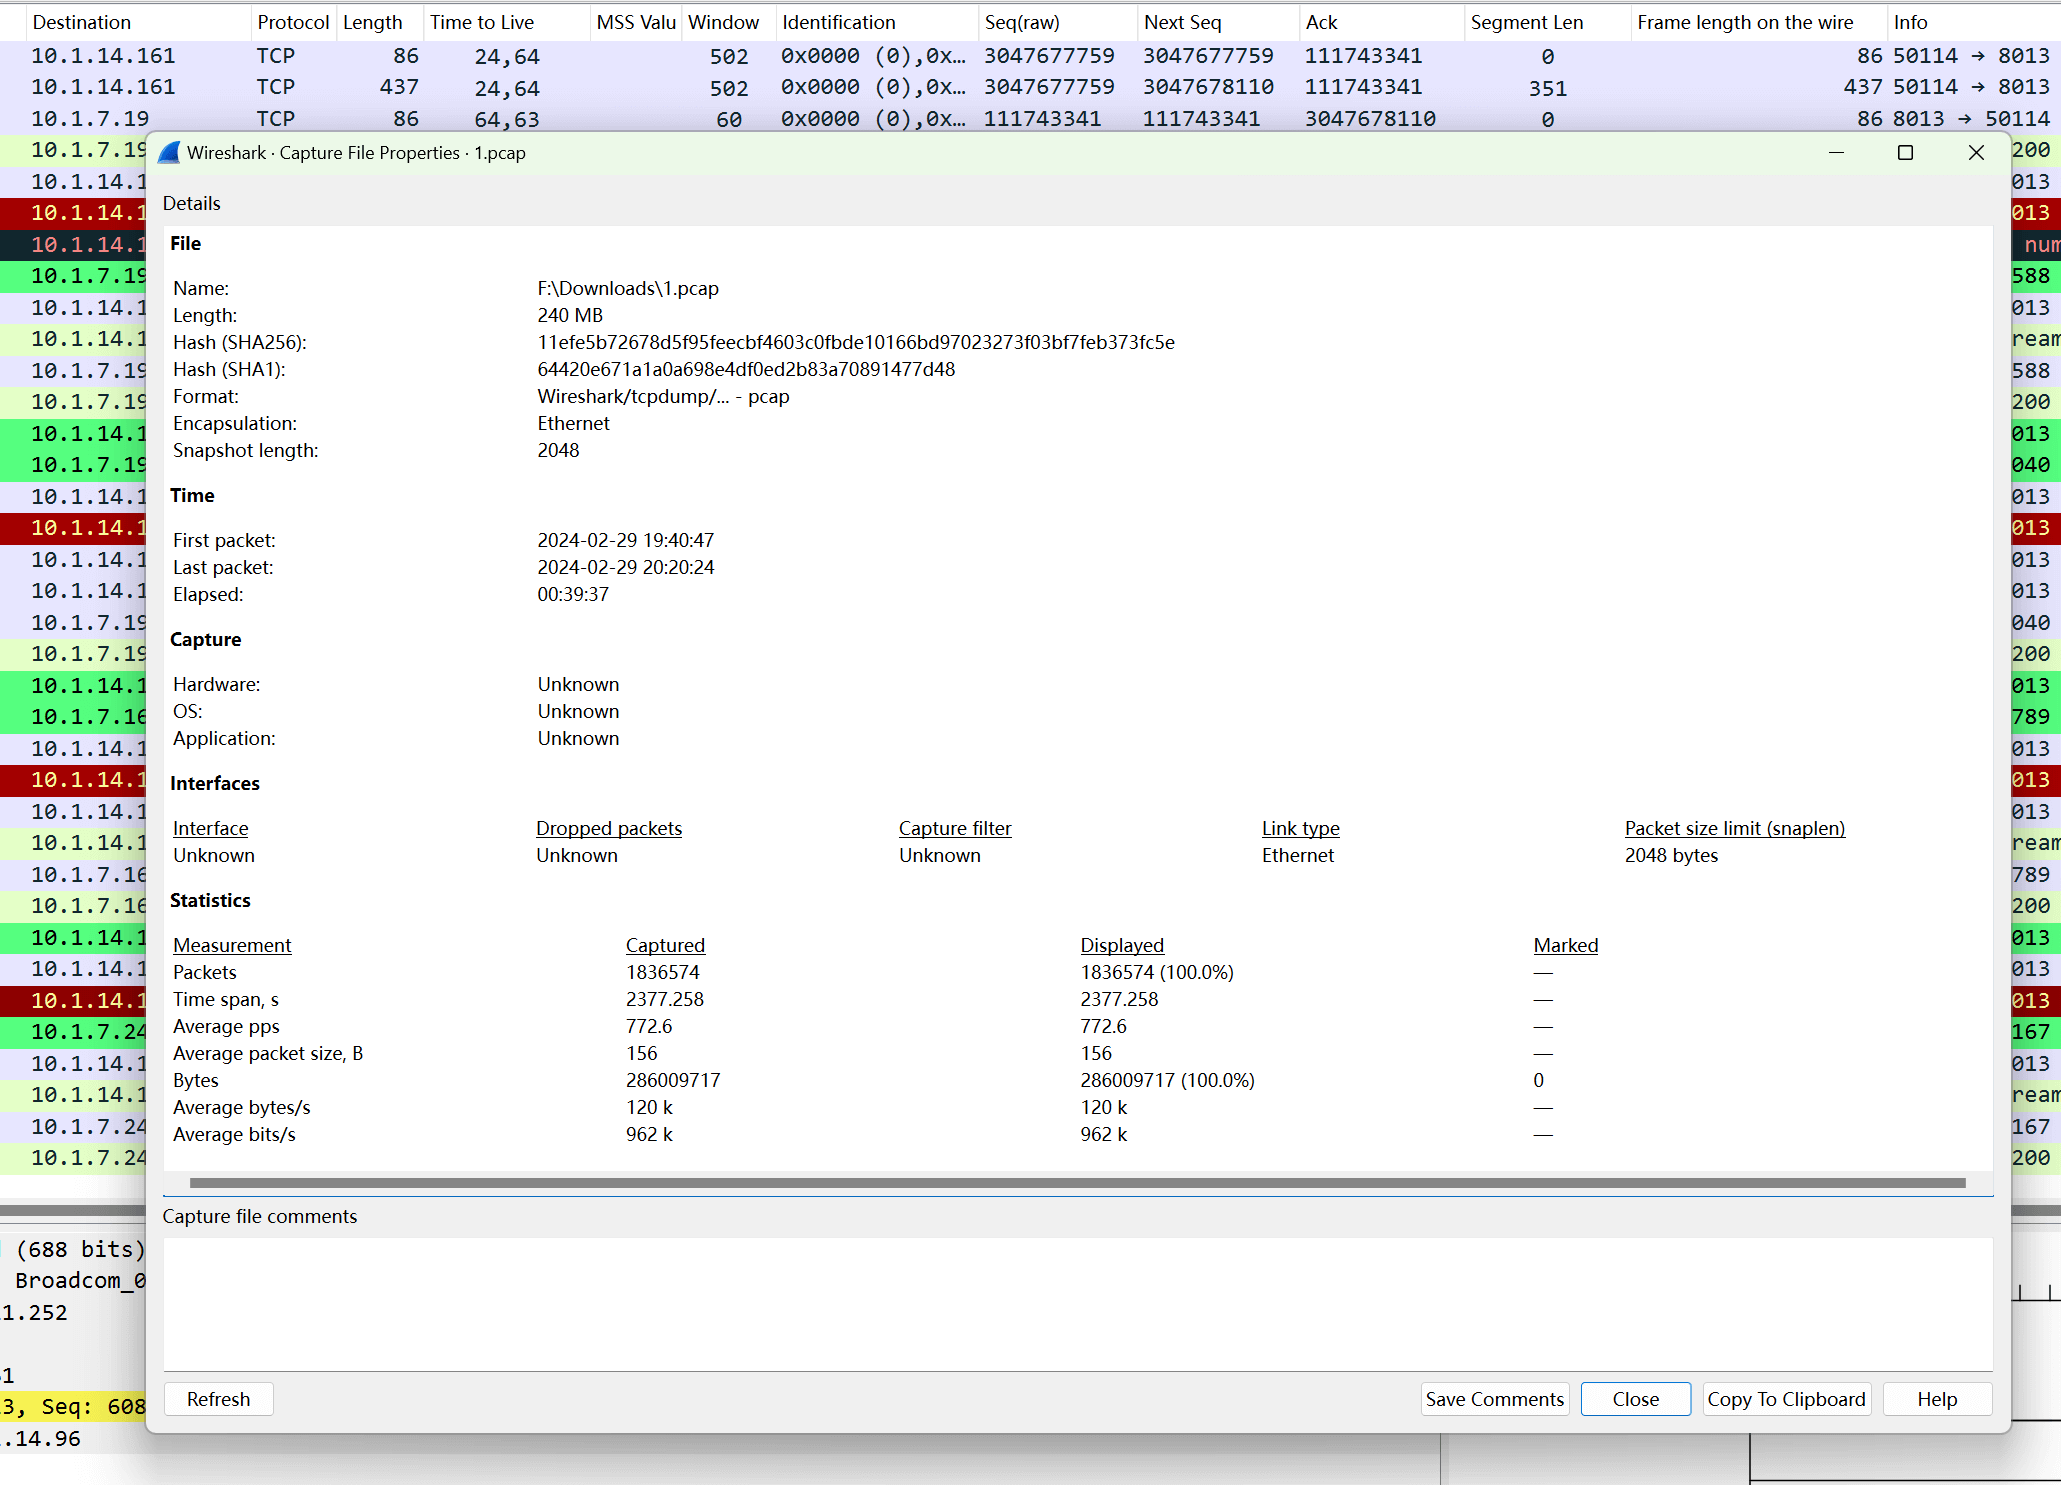
This information has the same output in Wireshark:
The actual meanings of each field are already very clearly written, and there is no need for precise filtering if it already meets your needs. If you require more refined control and expanded usage, please continue reading below.
1. General Options
1) Show File Type (-t)
Displays the format type of the packet capture file. The file extension may not fully match the actual file format type when saved. The extension can be arbitrarily modified by changing the file name suffix. The parameter analyzes the actual file injection format, not by analyzing the file suffix:
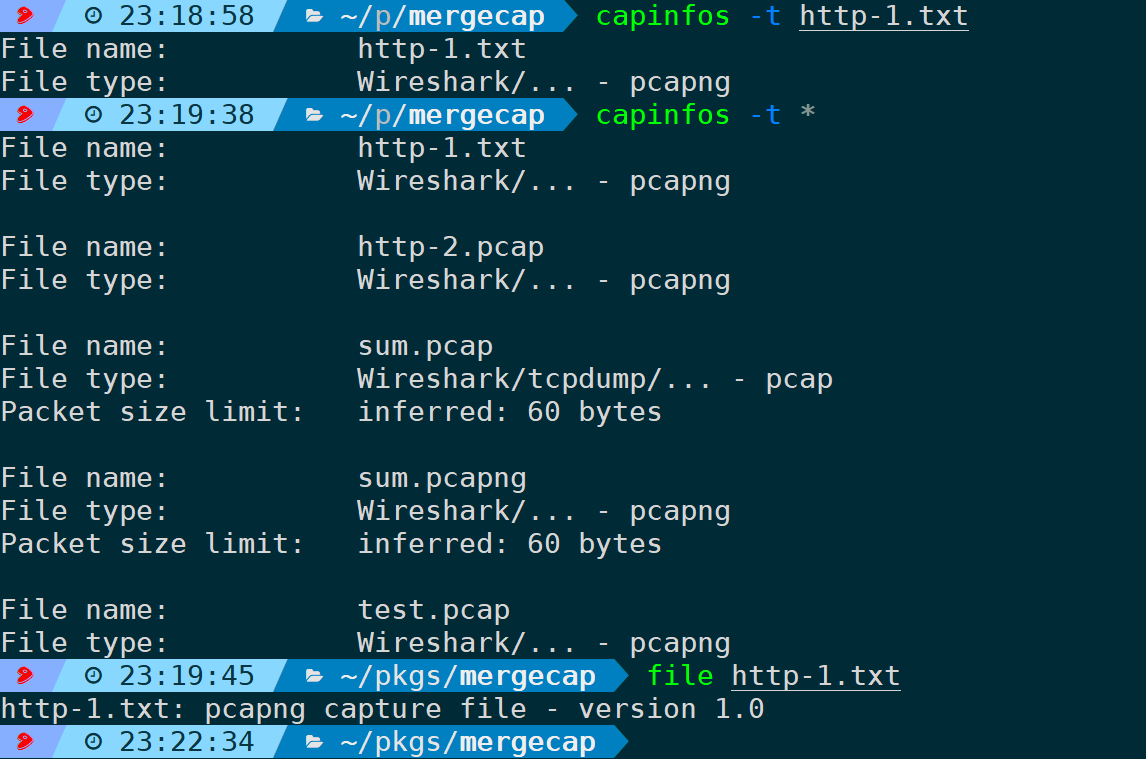
For example, in the example above, the file http-1.txt ends with a txt extension, but the actual file format is pcapng. The file command can also check the format used to store the file; at the same time, using the wildcard * matches all files in the current directory. The files sum.pcap and sum.pcapng have an extra line: this line is the inferred length of the data frames in the packet file, which are actually saved after being truncated and merged.
2) Show data link layer protocol encapsulation type (-E)
This parameter will display the encapsulation protocol used by the data link layer, usually Ethernet. Linux cooked-mode capture may also appear. For what Linux cooked-mode capture is, you can refer to what the author wrote. Simply put, it is a virtual protocol that may appear when the capture device is specified to be all (-i any) when capturing packets on Linux.
For example, the following case:
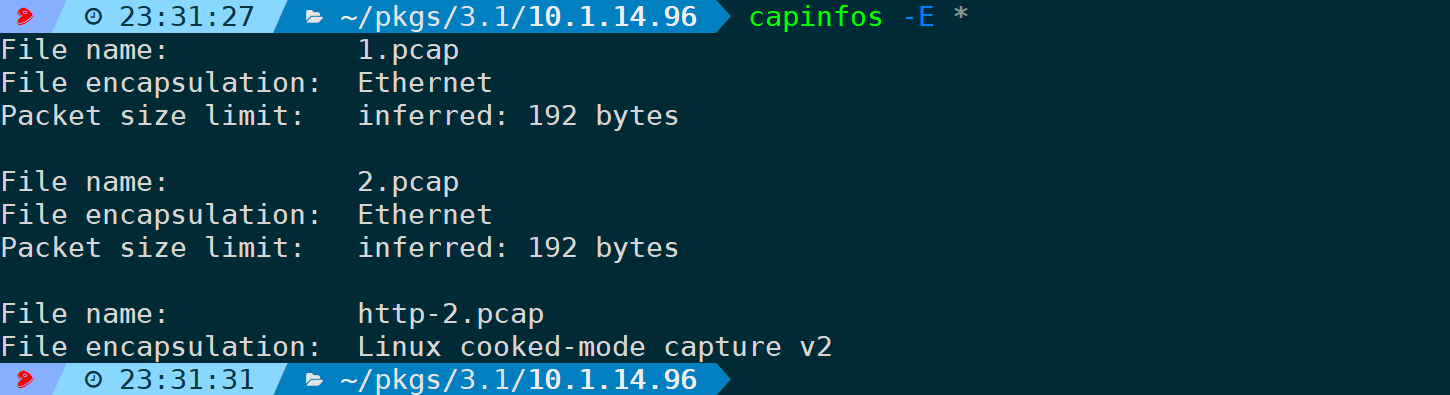
The link layer protocols of 1.pcap and 2.pcap are both Ethernet, and the inferred size of the data frames in the packet file is 192 bytes. The link layer protocol of http-2.pcap is Linux cooked-mode capture because this packet was captured and saved through.
3) Display interface information of the packet file and link layer protocol (-I)
The -I option can help understand the source of packets in the packet capture file, such as network interfaces, link layer protocols, etc.:
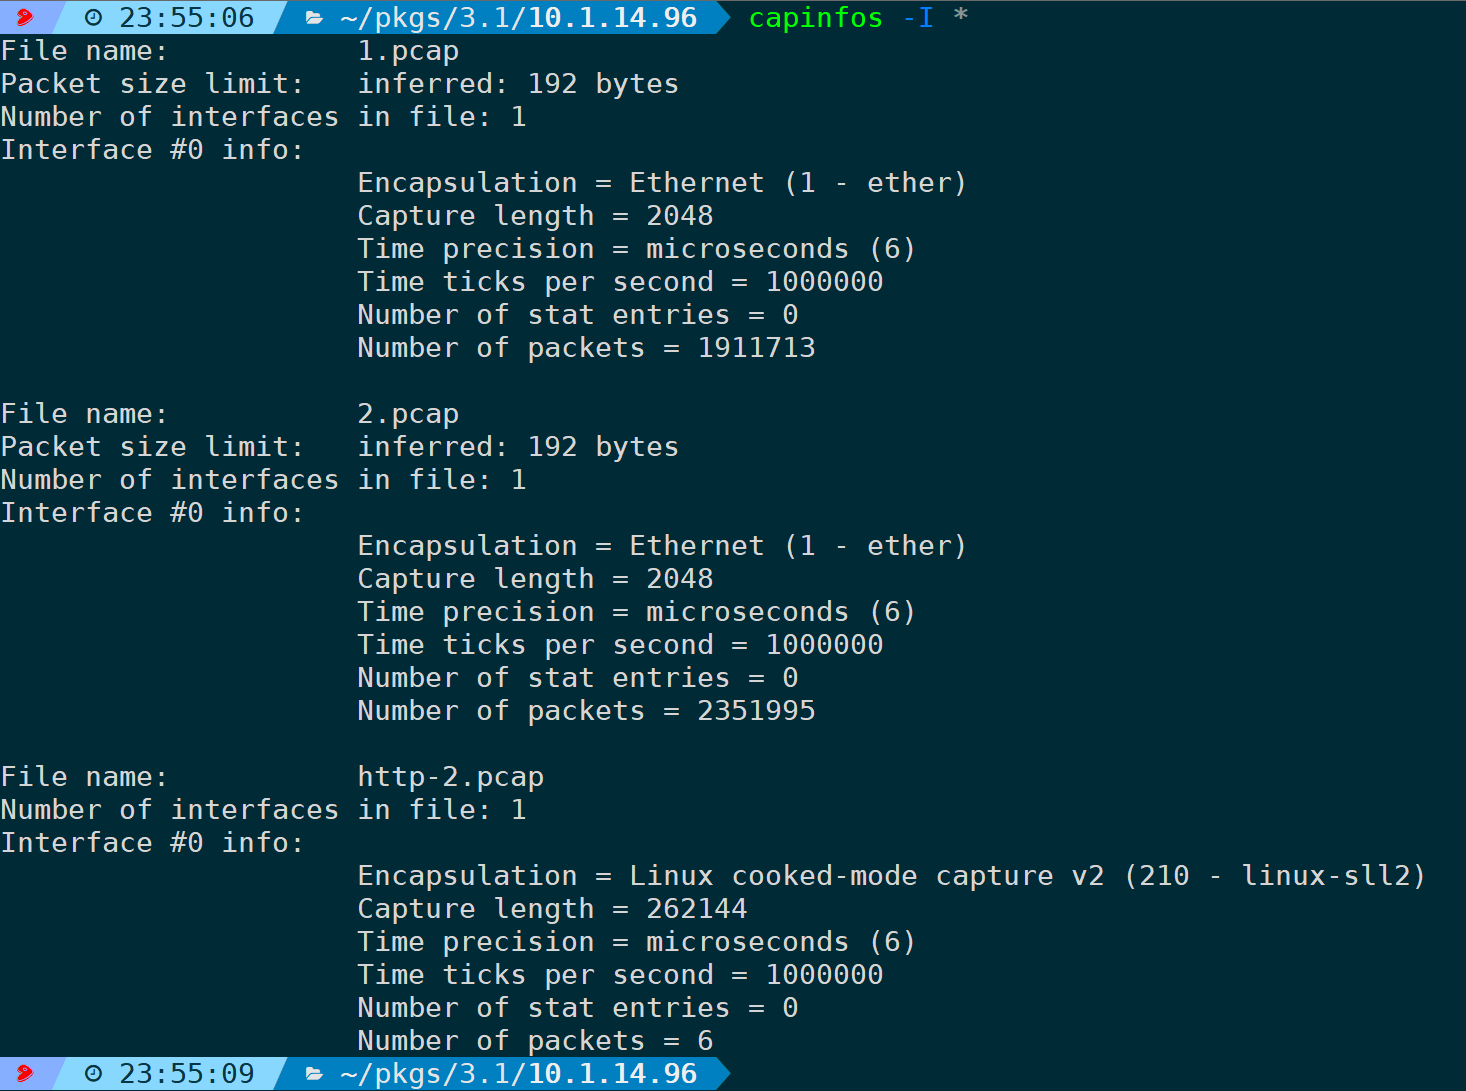
It also displays total packet amount, time precision, capture length, and other detailed information.
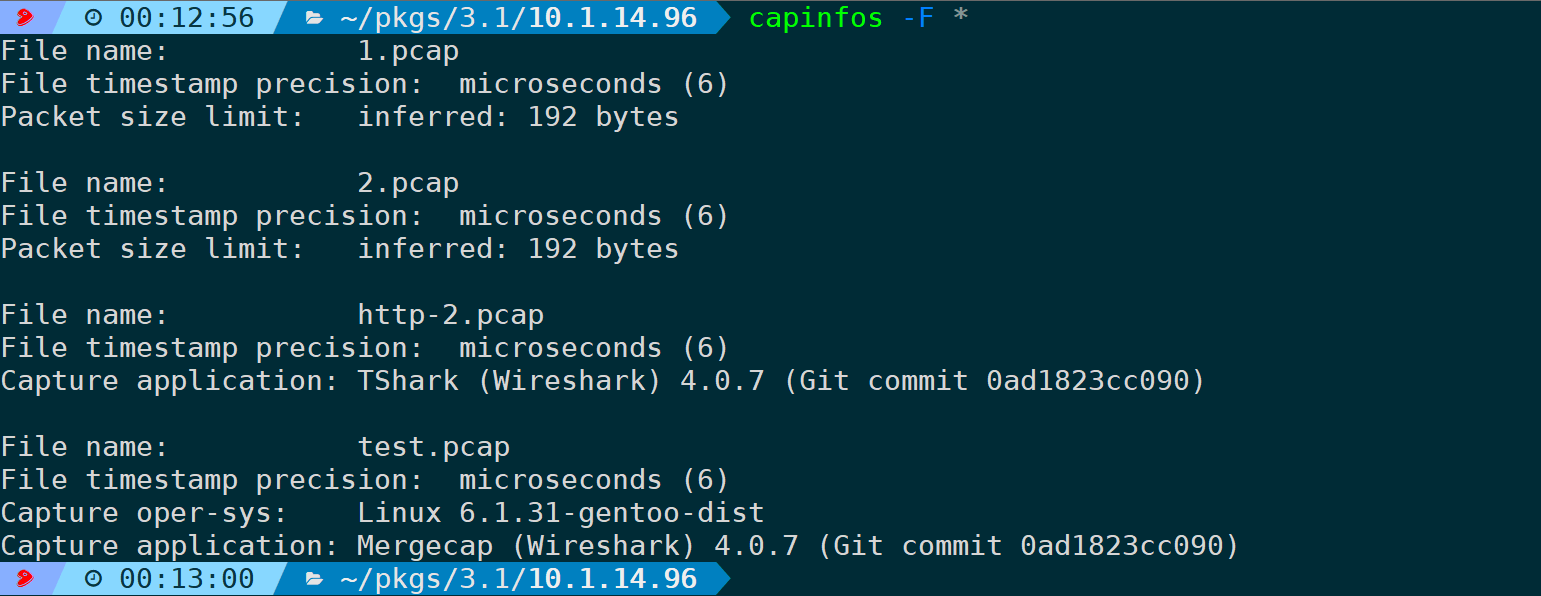
4) Show additional information of the packet file (-F)
This option will display as much additional information as it can recognize in the capture file, such as time precision, the inferred length of each data frame in the packet file, the version of the capture program used, and the operating system used:
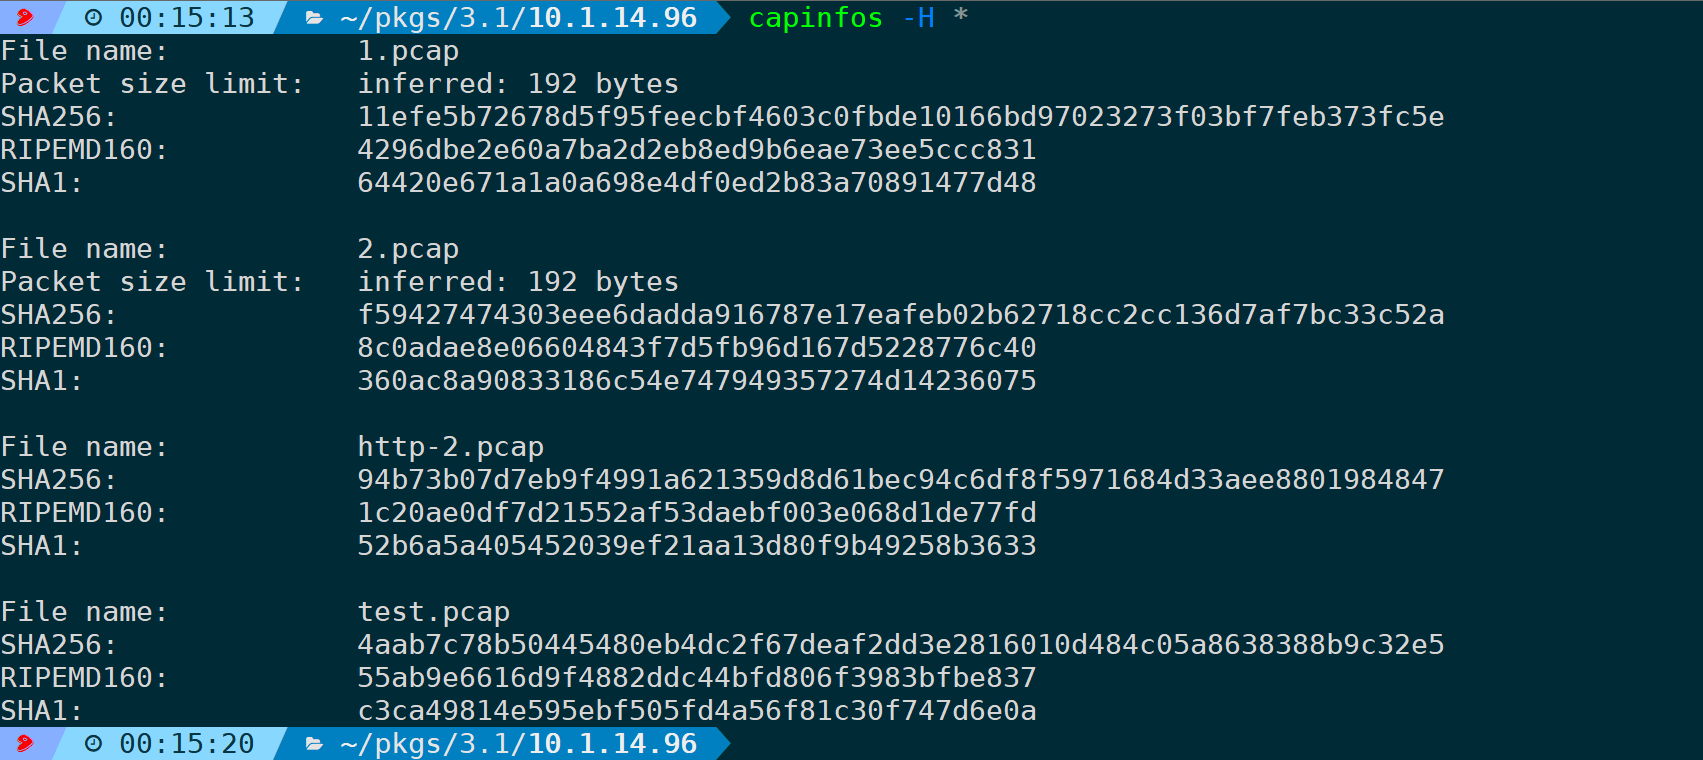
5) Show SHA256, RIPEMD160, and SHA1 hashes of the file (-H)
This parameter essentially merges the functions of tools like sha256sum, sha1sum, and ripemd160, which are used to calculate the hash values of files. This is useful for checking file consistency to prevent packet capture files from being tampered with:
2. File Size Options
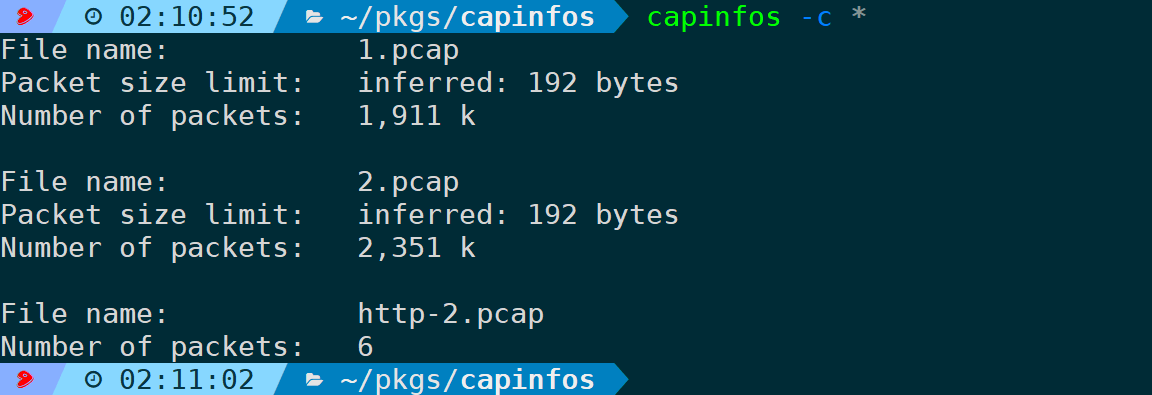
1) Display packet amount (-c)
This option is used to print the number of frames in the packet file:
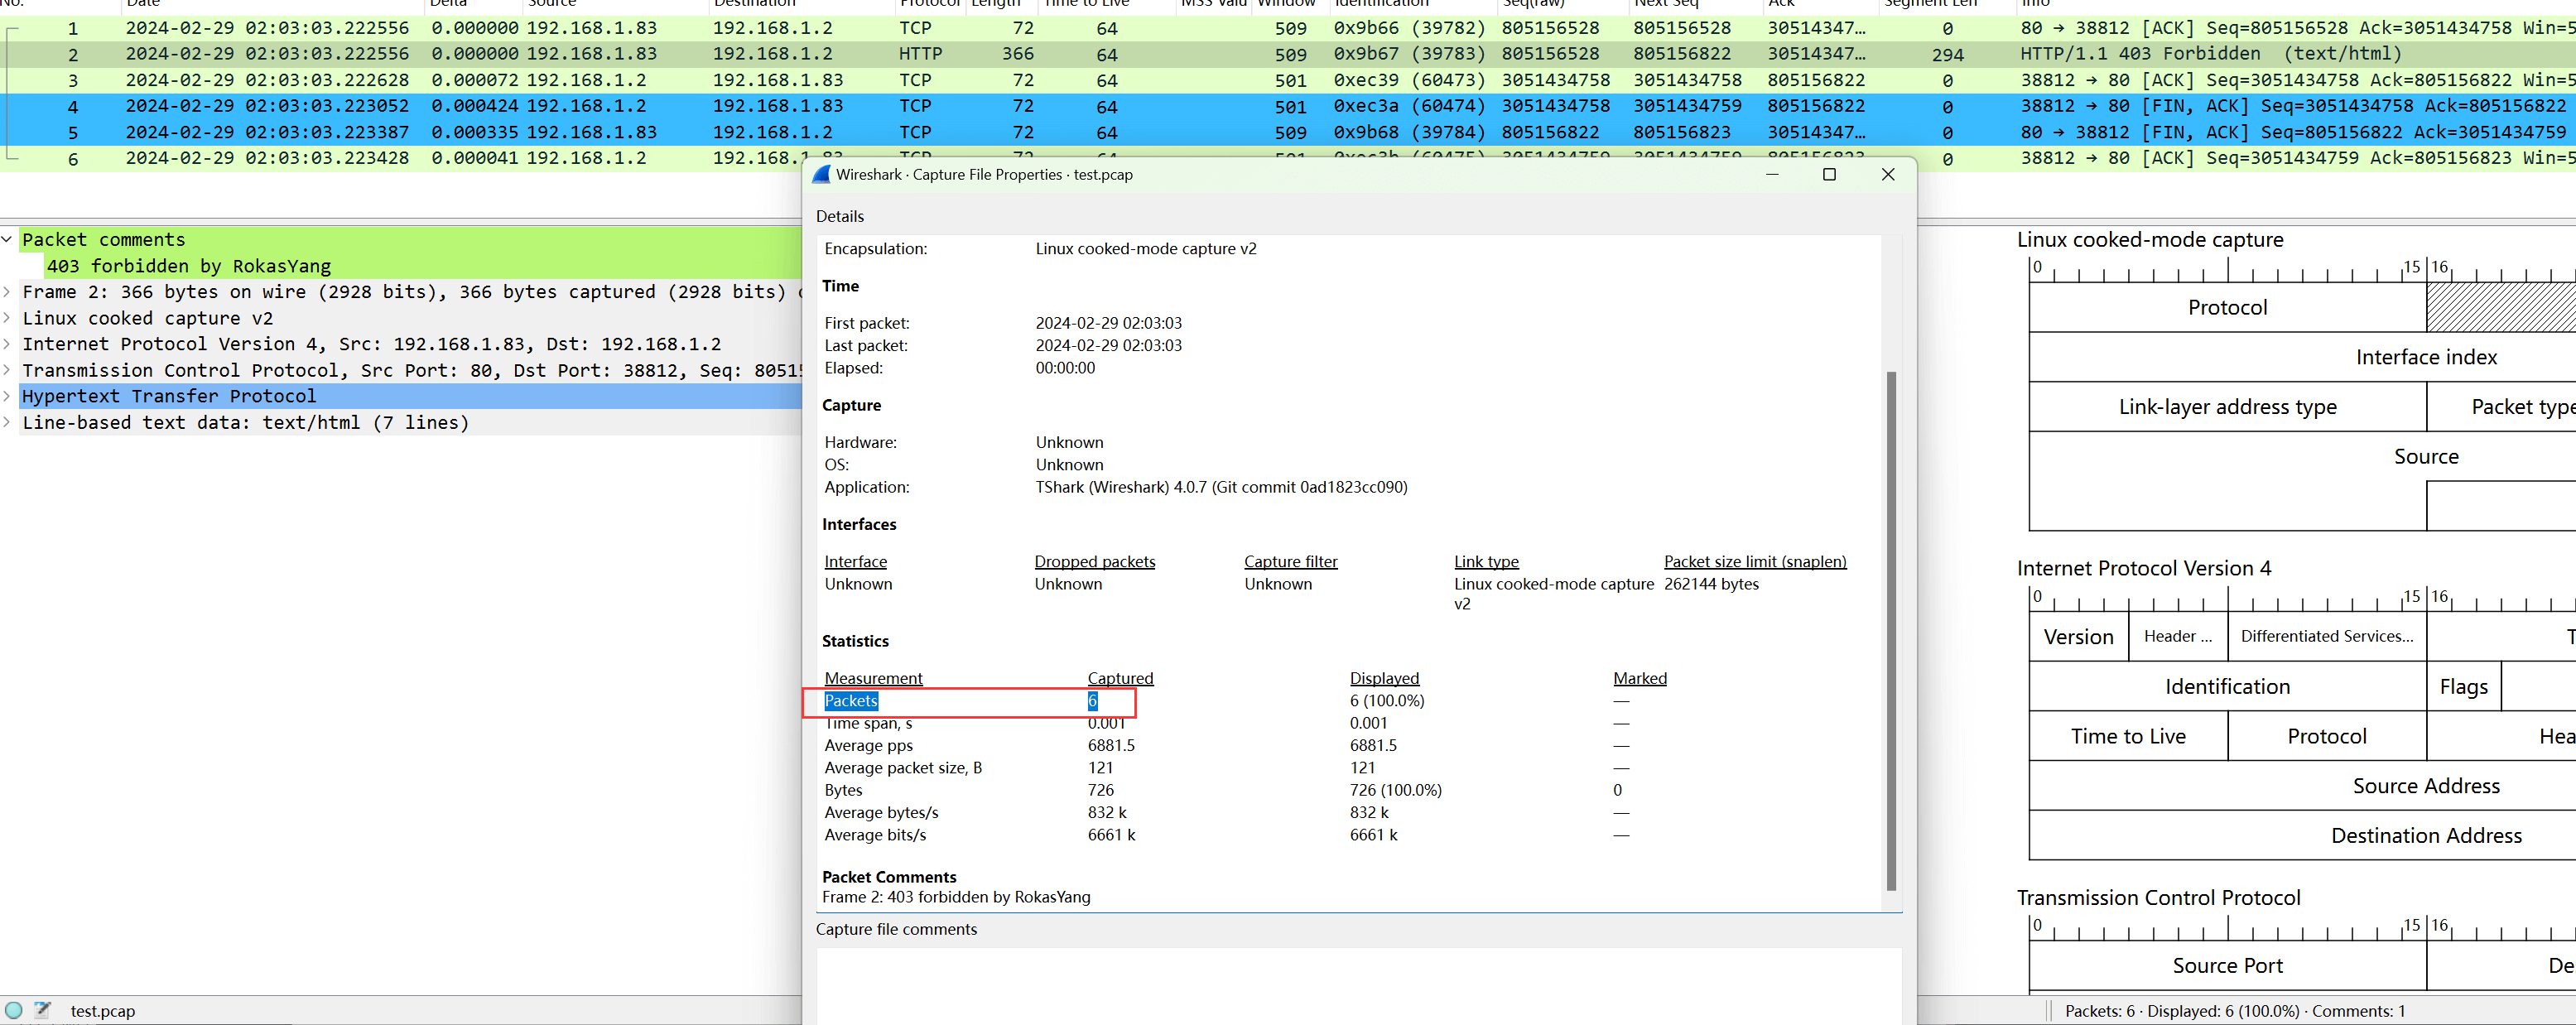
The corresponding section is also available on the Wireshark page:
2) Display the size of the capture file (-s)
Statistics on the size of the packet file in bytes:
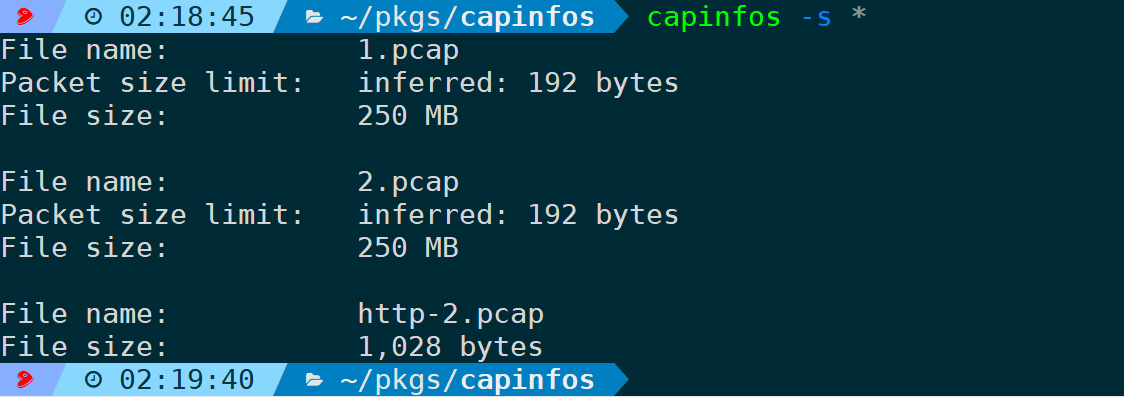
As illustrated, it displays the file size field, and if the file is too large, it will automatically convert units.
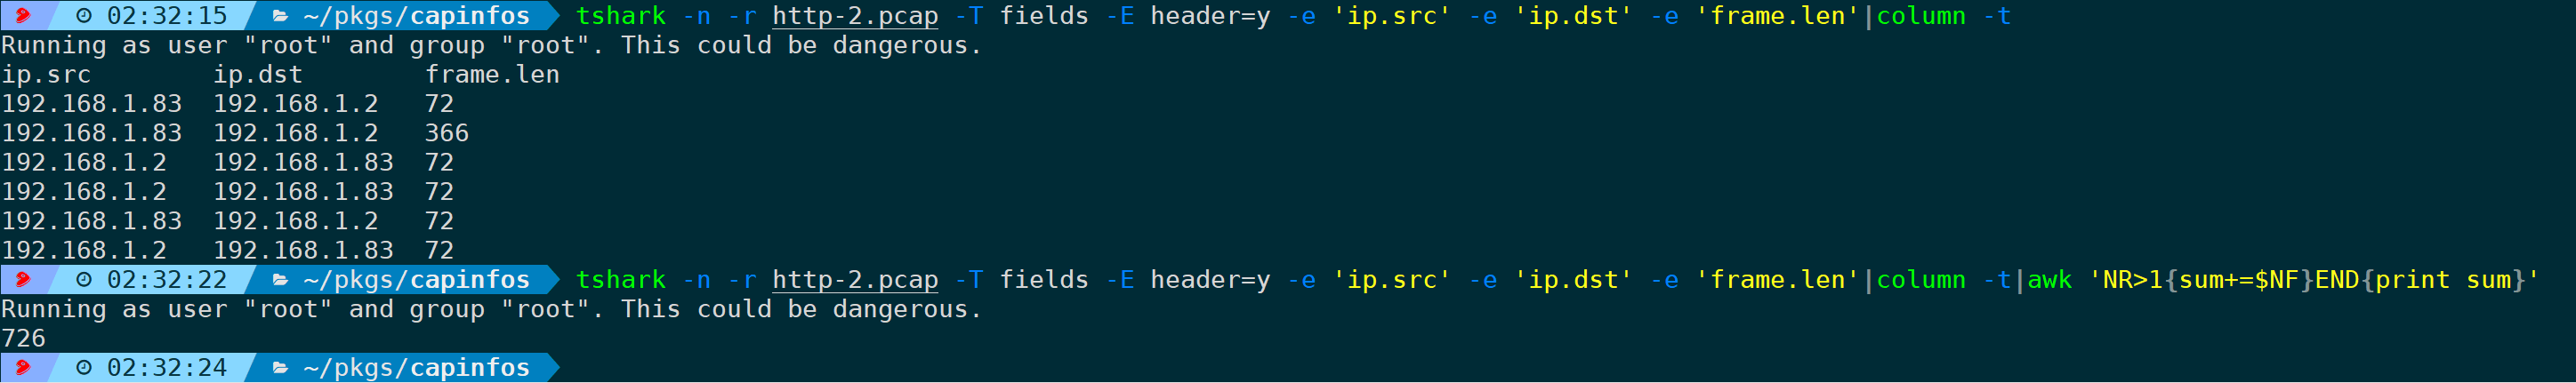
3) Display total length of all packets (-d)
Statistics of the total length of all packets in the packet file:
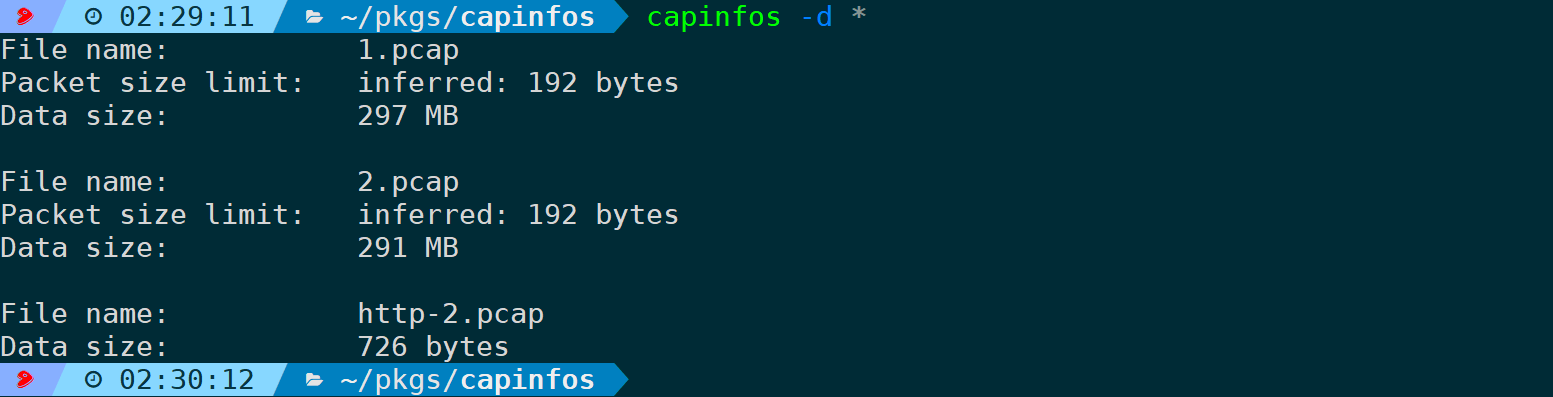
For example, in http-2.pcap, the calculated size is 726 bytes. We output the field values of each packet using tshark and accumulate them with awk, totaling 726 bytes:
4) Display packet size limit (-l)
This option will display the limit size when the packet file is captured (file hdr) and the inferred length of the data frames in the packet file:
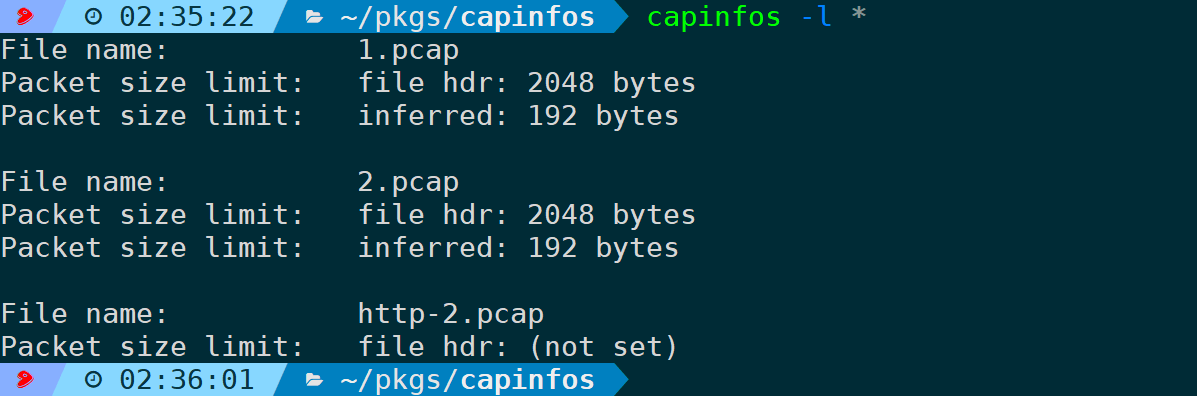
The output meanings are as follows:
3. Time Information Options
1) Statistics on capture duration (-u)
Statistics on the duration of packet capture in seconds:
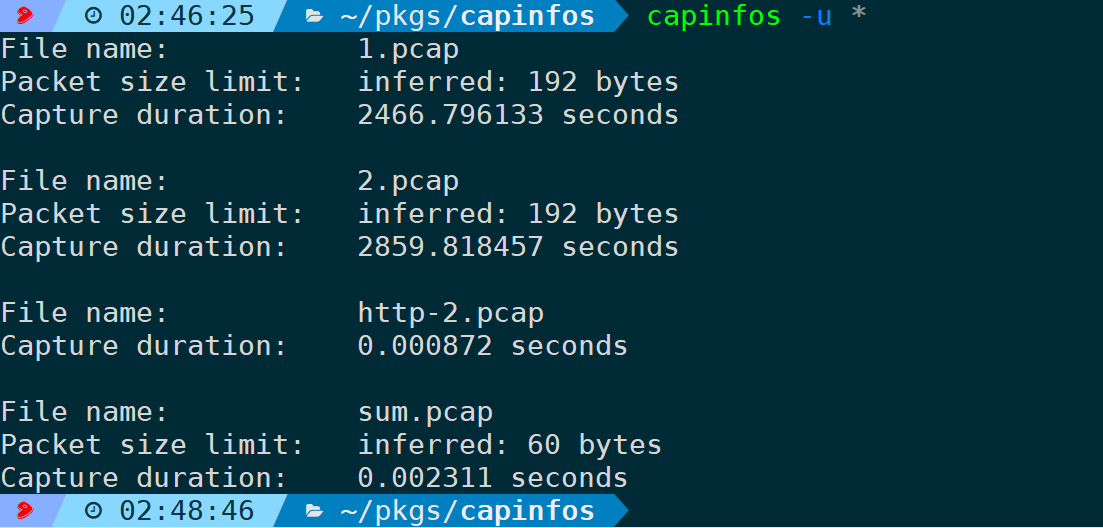
For 1.pcap, as shown in the figure above, the -u statistics duration is 2466.796133 seconds. First, use the -I option to obtain the total packet amount of the packet file:
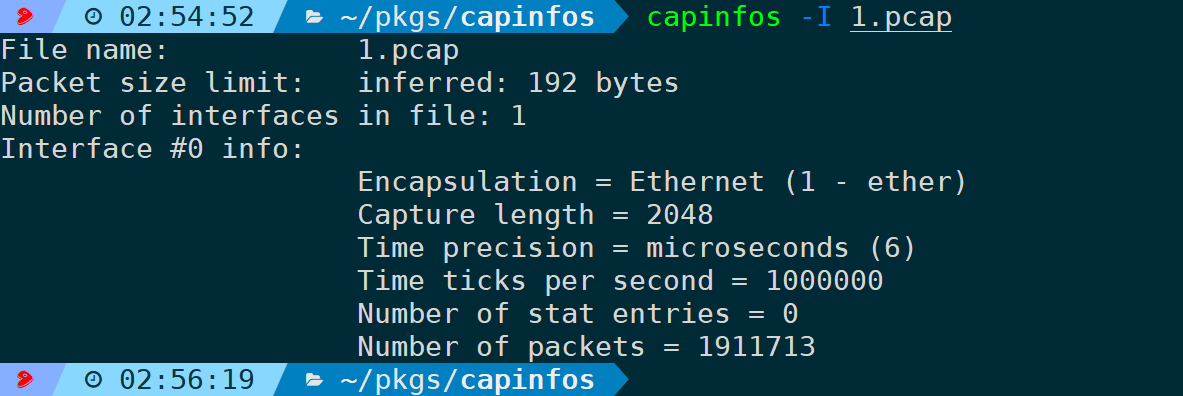
The packet amount is 1911713, which means the frame sequence number of the last frame is 1911713; now, use tshark to see the time interval of the last frame relative to the first frame:

The output result is 2466.796133 seconds, which meets expectations. So it is clear that the -u statistic method is actually the time difference between the end packet and the start packet.
2) Display the start time and date of the capture (-a)
This parameter needs no further explanation:
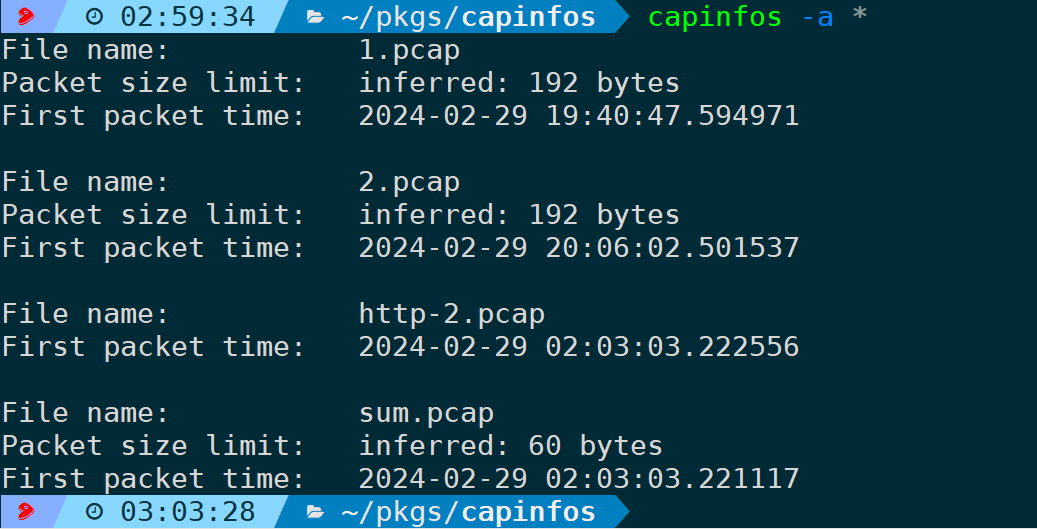
There are many ways to check the start time of the capture, such as outputting the time of the first frame via tshark:

-t ud statistical is UTC time, which needs to be added to 8 to get Beijing time.
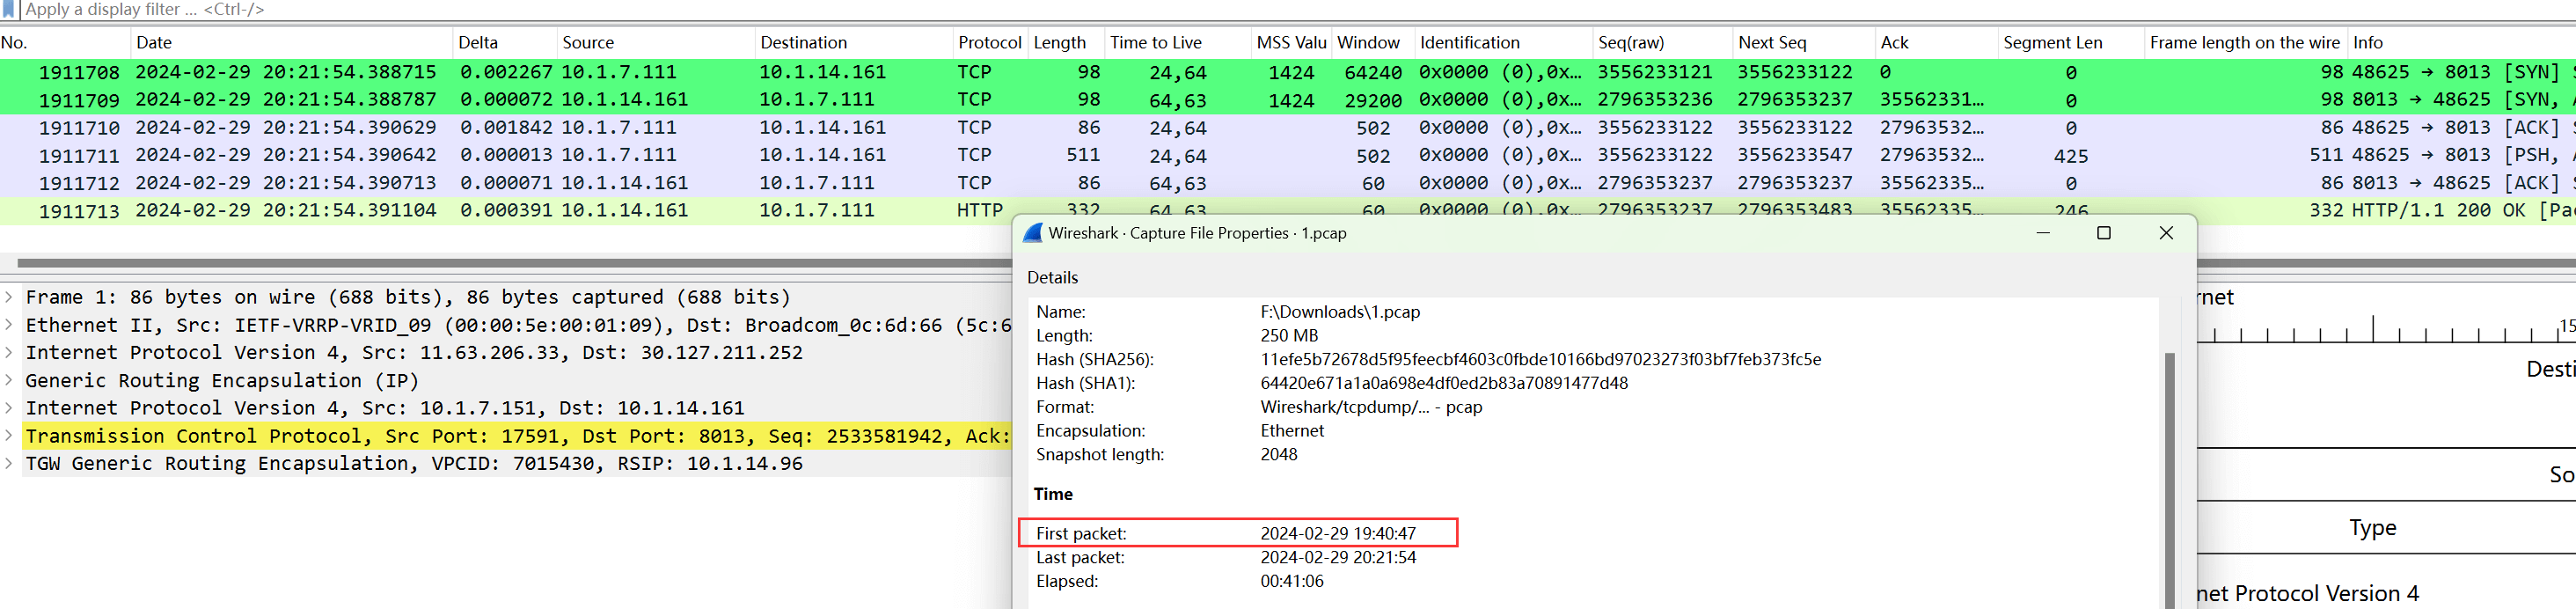
You can also see the start and end packet times in the capture file properties of Wireshark:
3) Display the end time and date of the capture (-e)
Opposite to the start, it displays the end time of the capture, which is actually the time and date of the end packet:
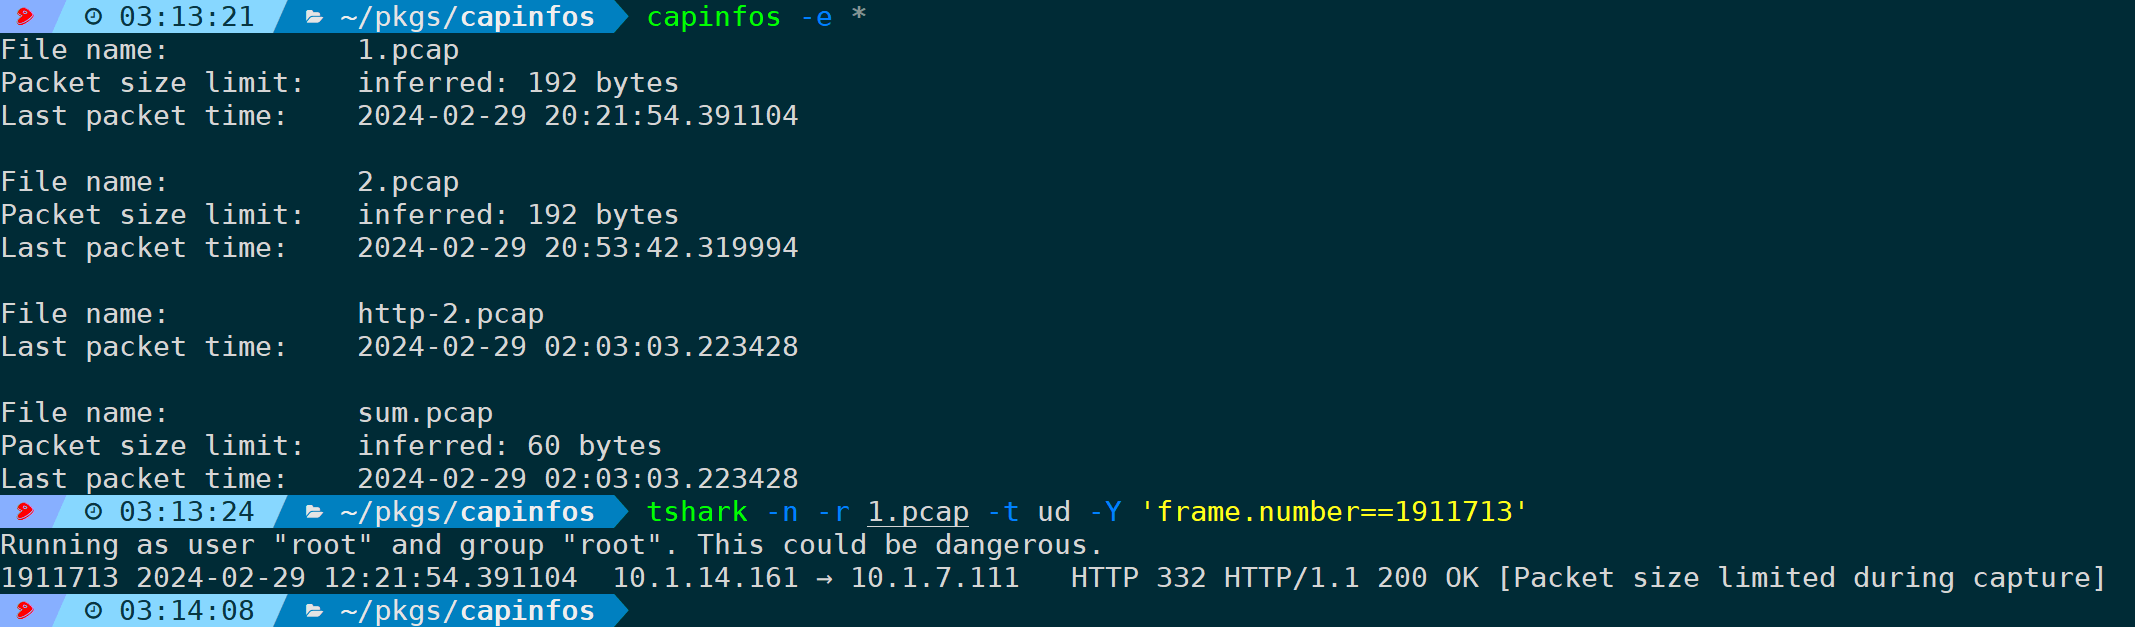
As illustrated, by calculating the UTC time of the end packet with tshark and adding 8, the same result can be obtained.
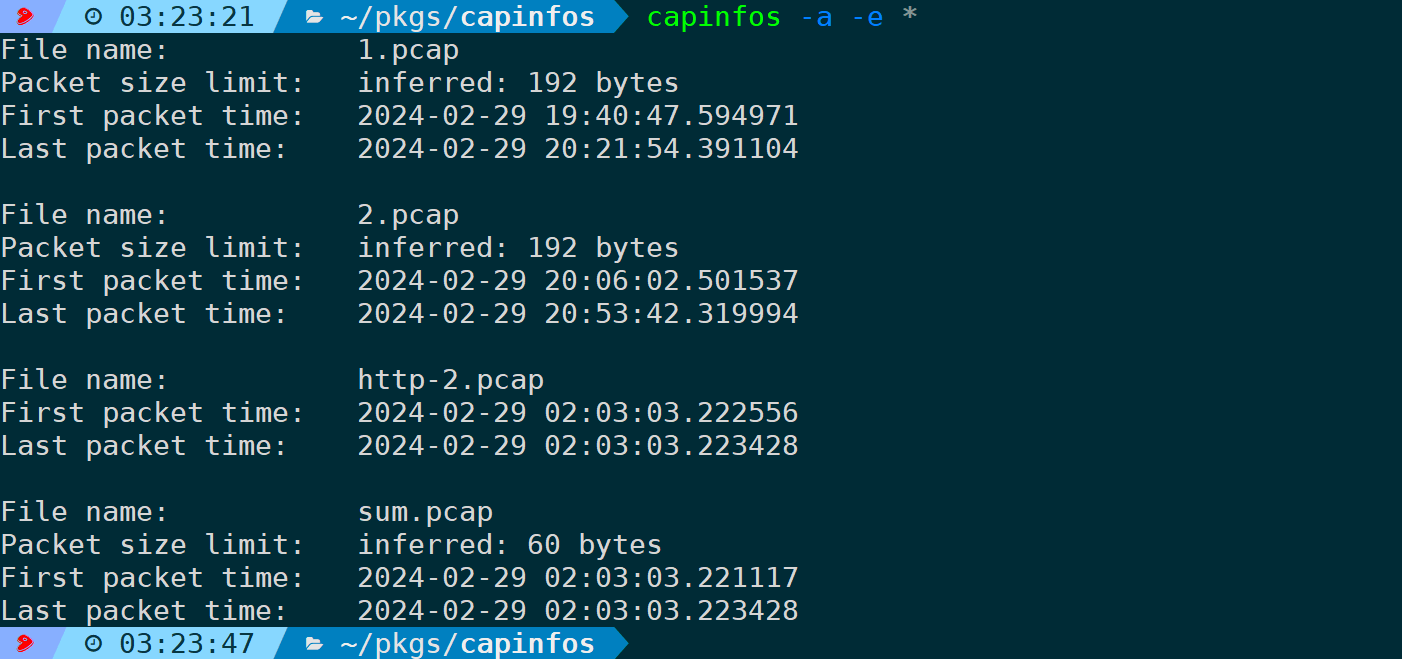
-a and -e can be used simultaneously to display both the start and end times:
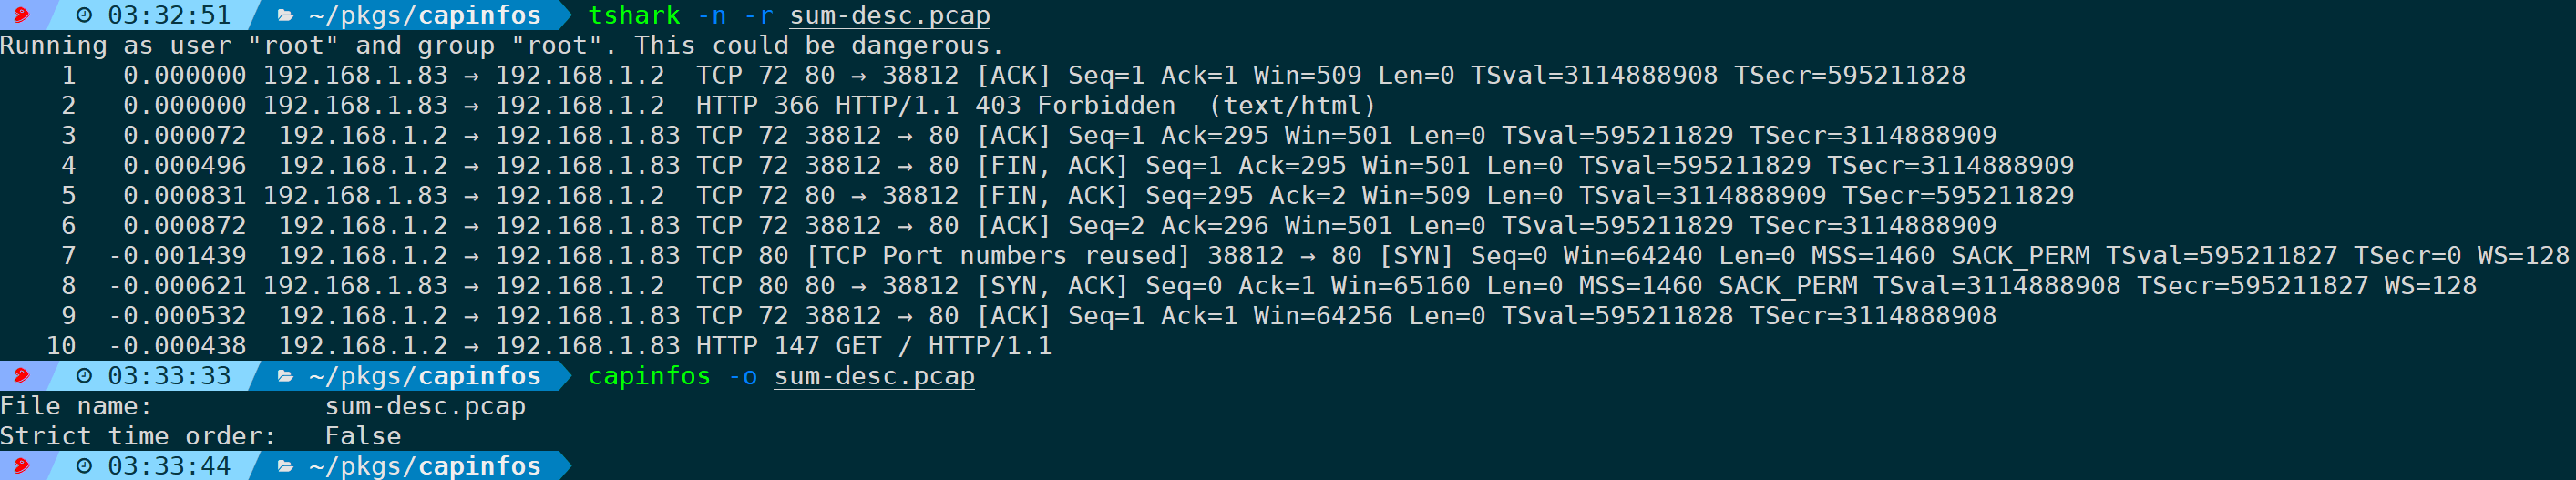
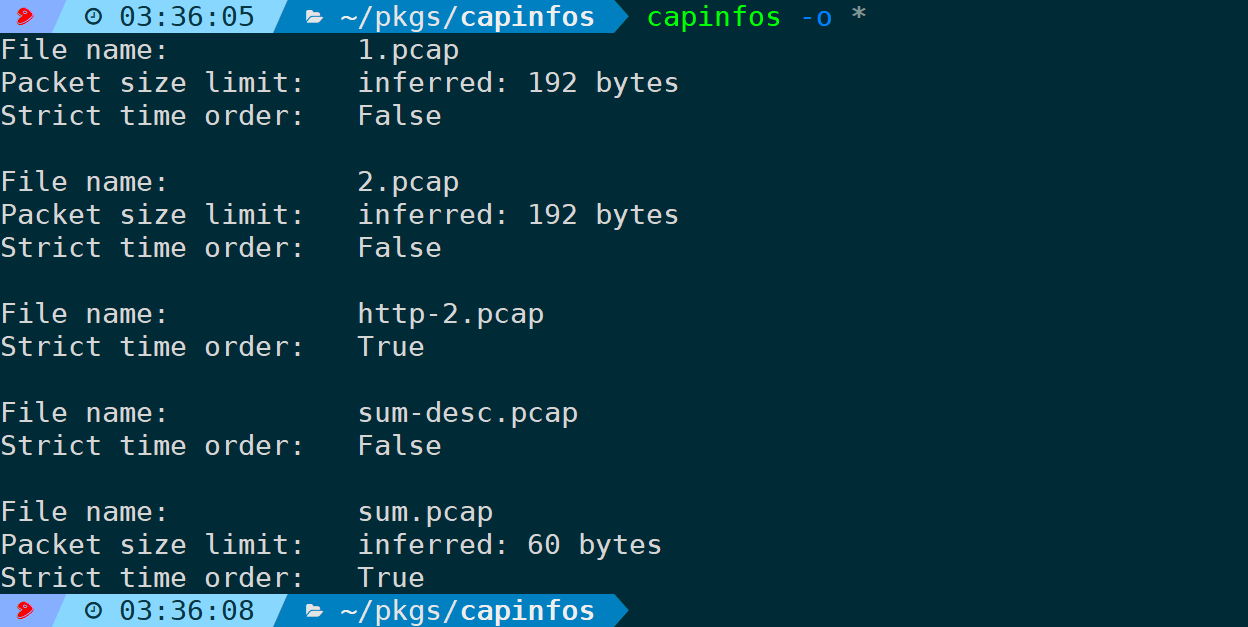
4) Display the chronological order authenticity of the capture file (-o)
When the sequence of data frames is not strictly arranged in chronological order, it will be judged as False; otherwise, it will be judged as True:
For example, the following example:
sum-desc.pcap packet sequence is not strictly sorted by absolute time, the option is recognized as False:
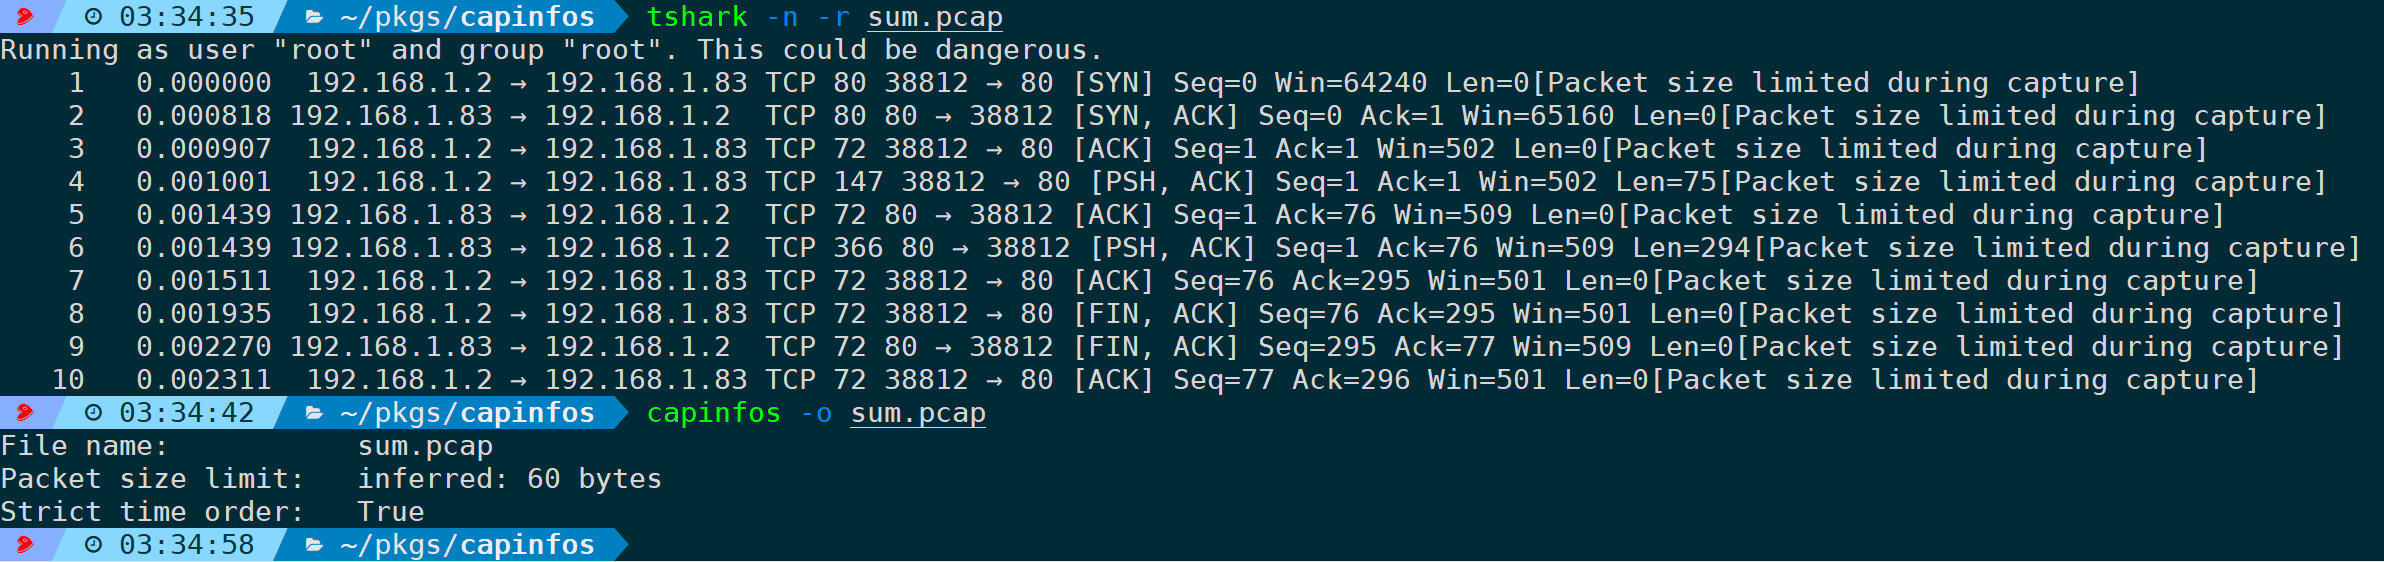
In contrast, sum.pcap packet sequence is strictly sorted by absolute time, recognized as True:
The paths also show 1.pcap, 2.pcap recognized as False:
Timestamp analysis can also determine the case, and setting the tshark time format as (delta time, interval relative to the previous frame), if a negative value occurs, it means the packet sequence is incorrect (i.e., it was received earlier, but sorted later):
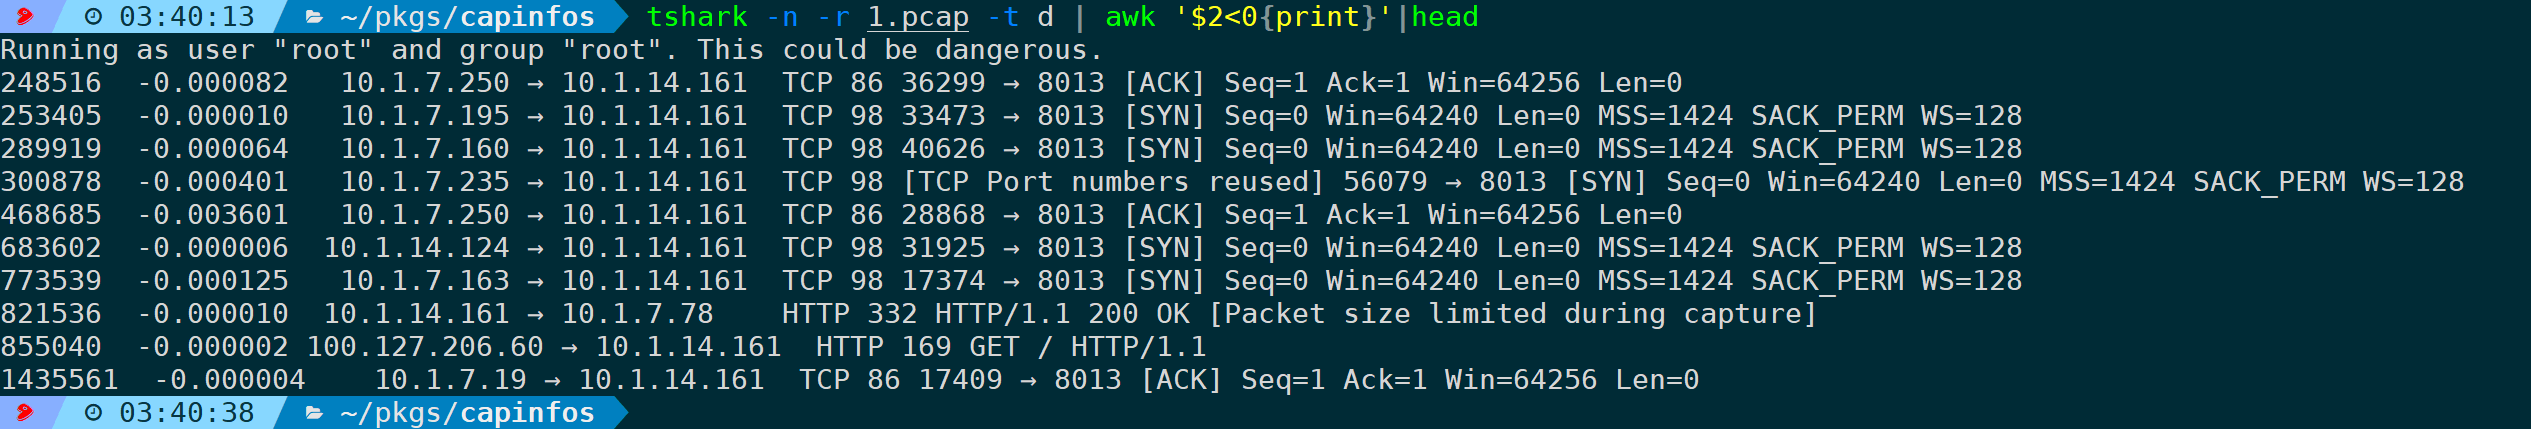
So the -o judgment is False.
4. Statistical Analysis Options
1) Statistics on average data transfer rate (-y/-i)
The output unit is bytes per second (Bytes/sec):
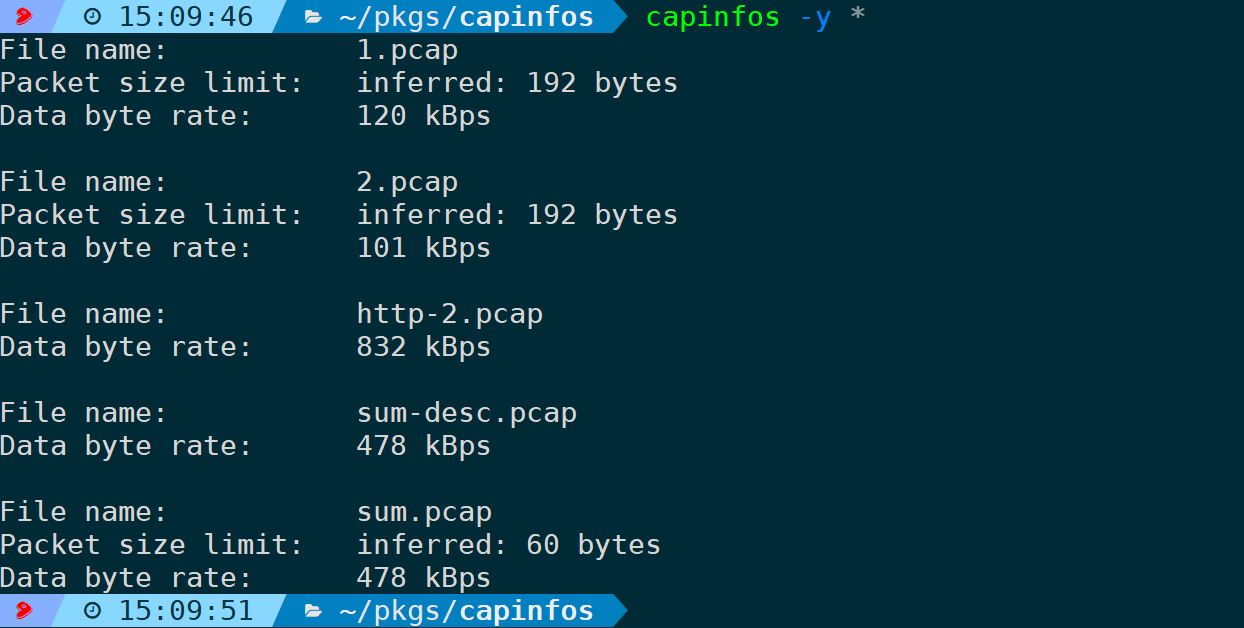
The field is the average data transfer rate.
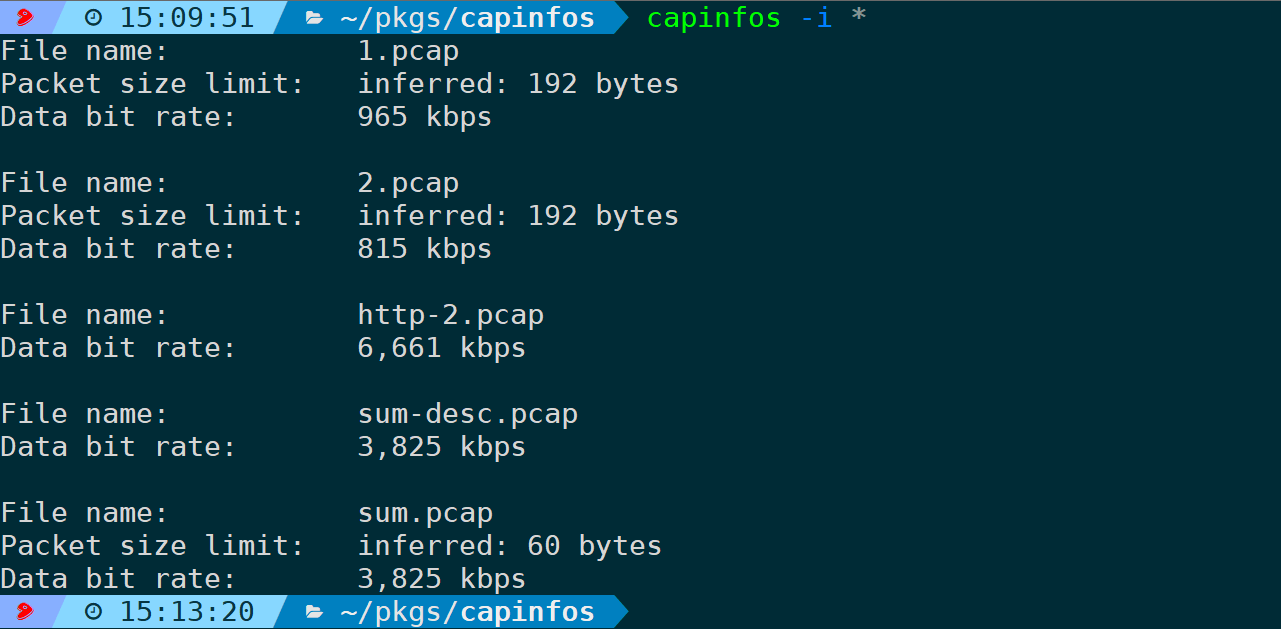
To output units as bits per second (bit/sec), use the option:
2) Statistics on average size per frame (-z)
By default in bytes:
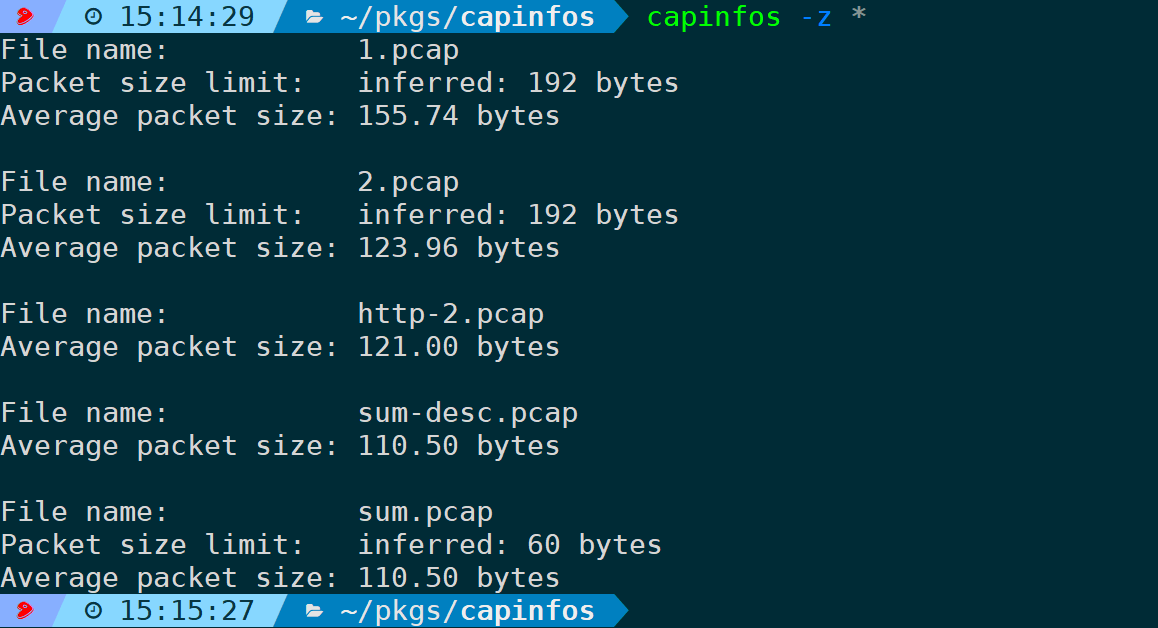
The field represents the average size per frame.
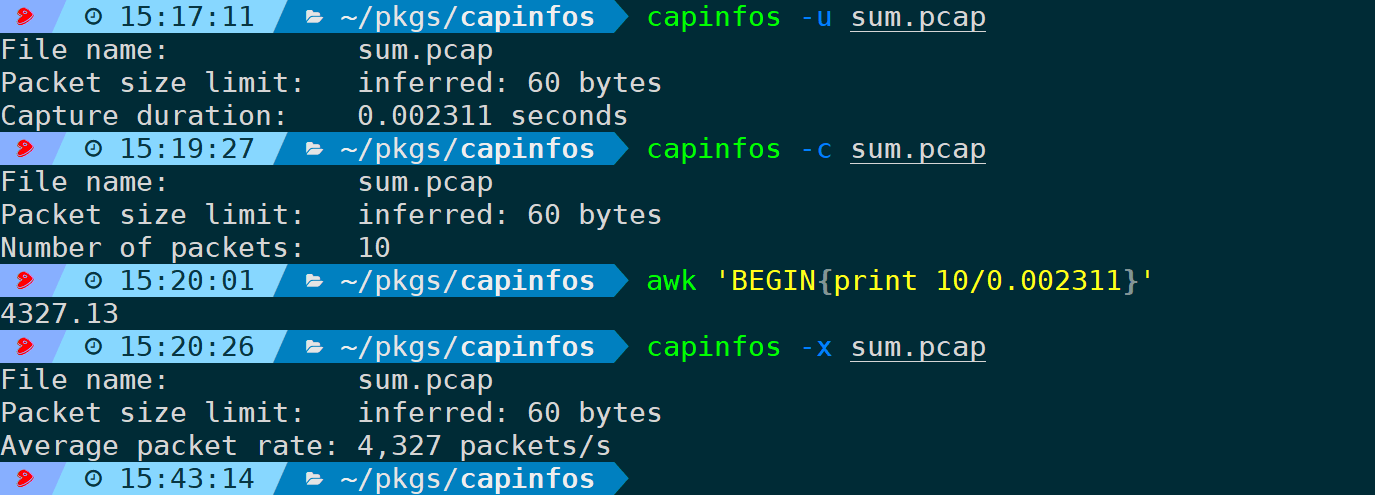
3) Statistics on average packet send/receive rate (-x)
The unit is packet amount per second:
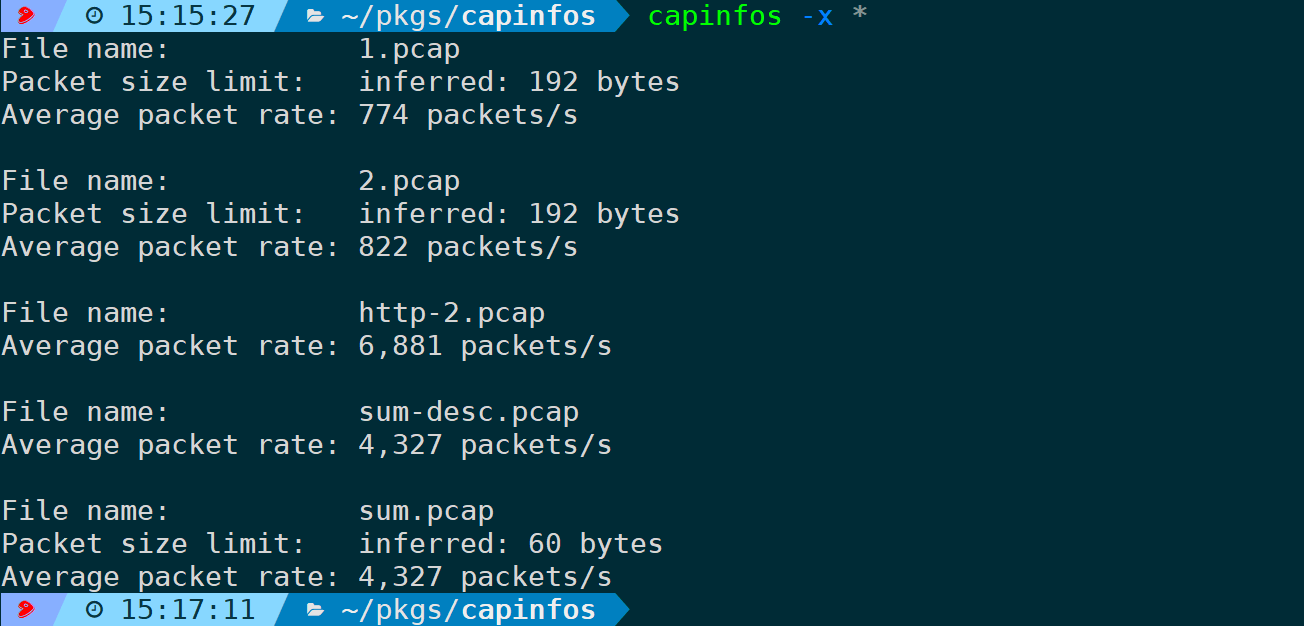
The calculation logic is simple, average packet rate = total packet amount / total time, for example, sum.pcap:
5. Output Format Options
| Option | Meaning |
|---|---|
| -L | Generate long report, default behavior |
| -T | Generate in tabular form |
| -M | Display machine-readable values in long report |
It is worth mentioning the parameter below has a series of sub-options:
| Option | Meaning |
|---|---|
| -R | Generate header records, default behavior |
| -r | Do not generate header records |
| -B | Use TAB character to separate fields, default behavior |
| -m | Use comma (,) to separate fields |
| -b | Use space to separate fields |
| -N | Do not quote information, default behavior |
| -q | Use single quotes to quote information |
| -Q | Use double quotes to quote information |
What to use follows your needs. If you need to read a lot of packet information content at once, consider redirecting the output to an Excel file, for example:
The effect when opened with Excel:

The output fields contain all the information since no other options are added, defaulting to -A, which outputs all information:

Combined with the parameters mentioned earlier, you can combine them at will. For instance, to display packet amount, file type, hash values, capture duration, and average transfer rate, it can be:
In this case, the output fields are the contents we want:

4. Conclusion
This article introduced the usage of capinfos and its application cases in real scenarios, covering the usage analysis of all important parameters. If there are no special requirements, not adding any parameters is the fastest and most efficient way. At the same time, capinfos is a practical command-line tool in the Wireshark suite, convenient for quickly viewing meta-information of packet capture files (including but not limited to pcap, pcapng, etc.), such as file type, data link layer type, packet quantity, file size, and capture duration, aiding in quickly determining if the packet capture file covers the abnormal time point.