1. Purpose of the experiment
Strengthen the understanding of computer network communication protocols by focusing on Application Layer Protocols and use theoretical knowledge to solve practical problems. Learn the basic operations of Wireshark, capture and analyze data packets in a wired LAN, and become familiar with some application layer commands and protocols. By using Wireshark to analyze network activities, observe TCP protocol messages, and analyze communication timing, understand the working process of TCP, and master the working principle and implementation of both TCP and Application Layer Protocols. Learn to use Wireshark to analyze the process of TCP connection management, flow control, and congestion control and discover TCP performance problems.
2. Experimental tasks
2.1 Application layer protocol analysis
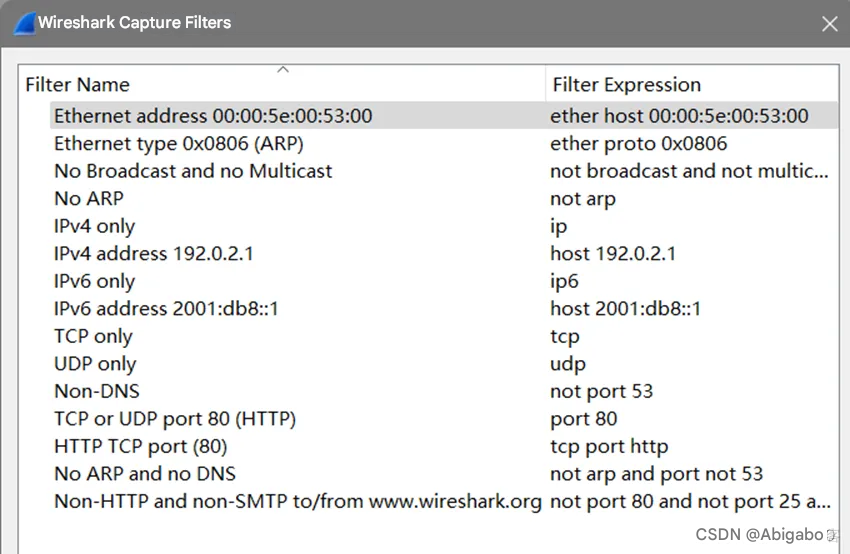
Learn to use Wireshark packet capture software and how to use filters.
Learn the basics of Wireshark: focus on capturing filters and display filters. Analyze HTTP and DNS protocols.
Test the curl command and access a web page. (Optional)
Use the telnet command to test the get command and visit www.baidu.com. (optional)
Use the telnet command to test the SMTP service and analyze its process. (Optional)
Test the tracert command and analyze its process.
Use nslookup to query domain name information and make a brief analysis.
2.1 Transport layer protocol analysis
TCP data flow tracking.
TCP connection establishment.
Termination of the TCP connection.
TCP connection reset.
The two experimental machines are locally connected to each other, and different network conditions are simulated in the experimental machines to observe various control phenomena of TCP. (Optional)
3. Experimental content (including analysis)
3.1 Application layer protocol analysis
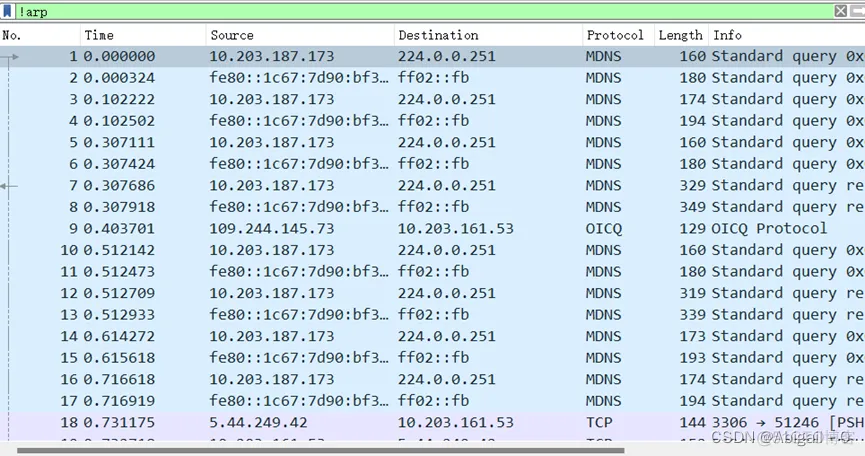
3.1.1 Learn to use Wireshark packet capture software and how to use filters.
(1) Open the capture filter
(2) Capturing packets
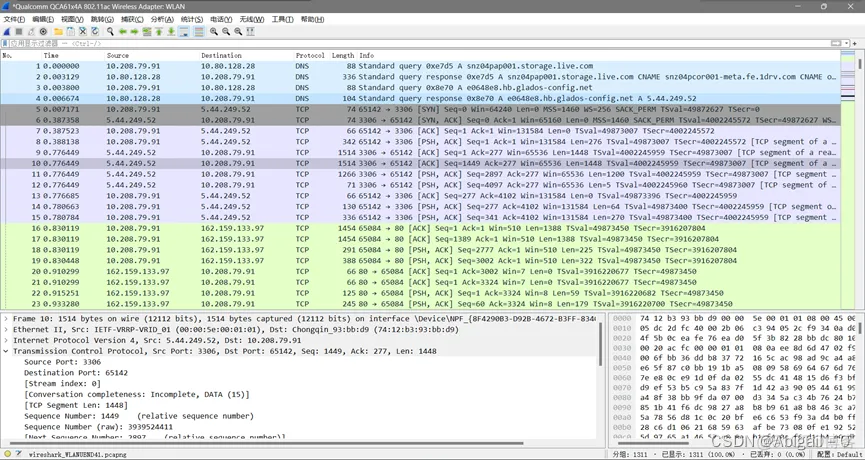
(3) Filter out all ARP packets in the Packet List (display filter usage)
3.1.2 Analyze HTTP and DNS protocols
1. Set the filter condition HTTP and start capturing packets
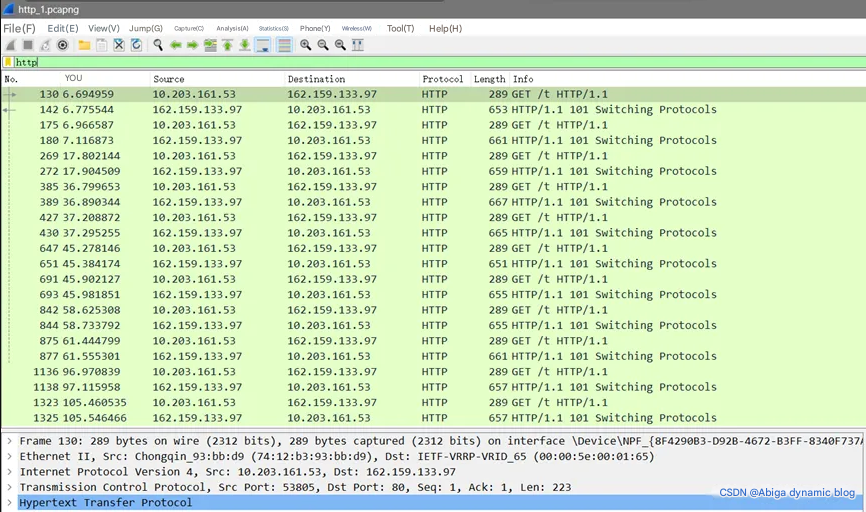
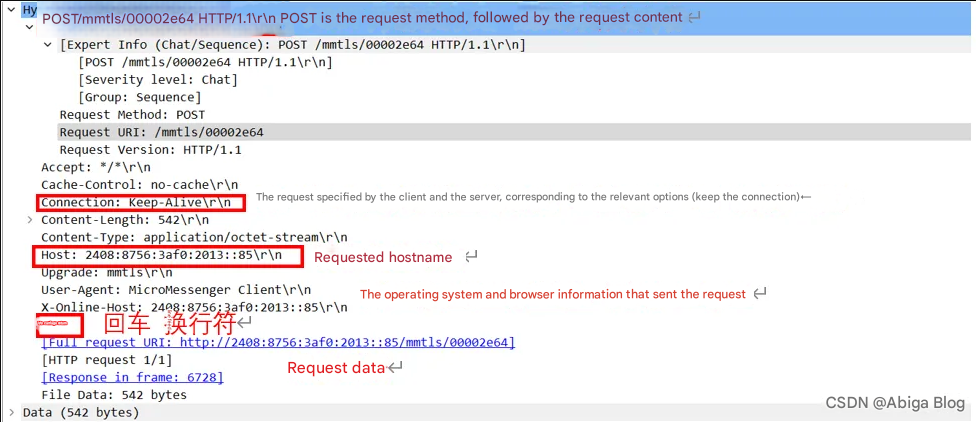
At this time, select one message for message analysis:

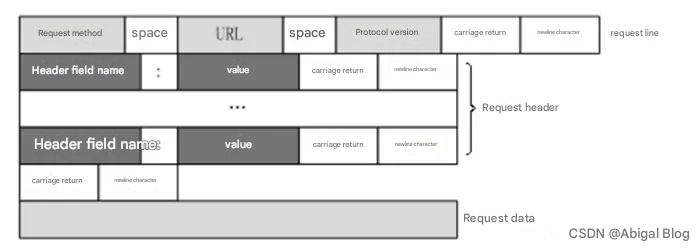
This packet is a request packet, and the bar below is its response packet. The structure of the request message is:
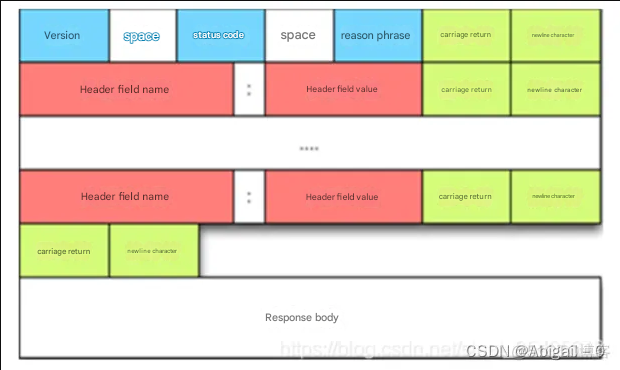
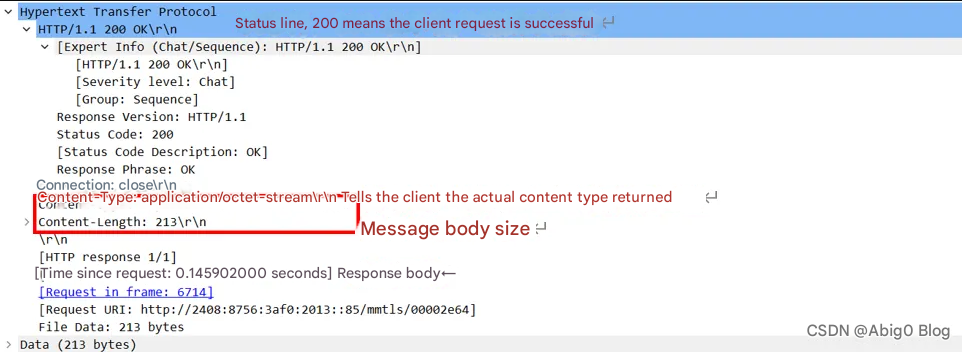
If it is a response packet, the response message structure is
As shown below
2. DNS analysis
Set the filter condition DNS and start capturing packets:

Analyze the request packet numbered 73:
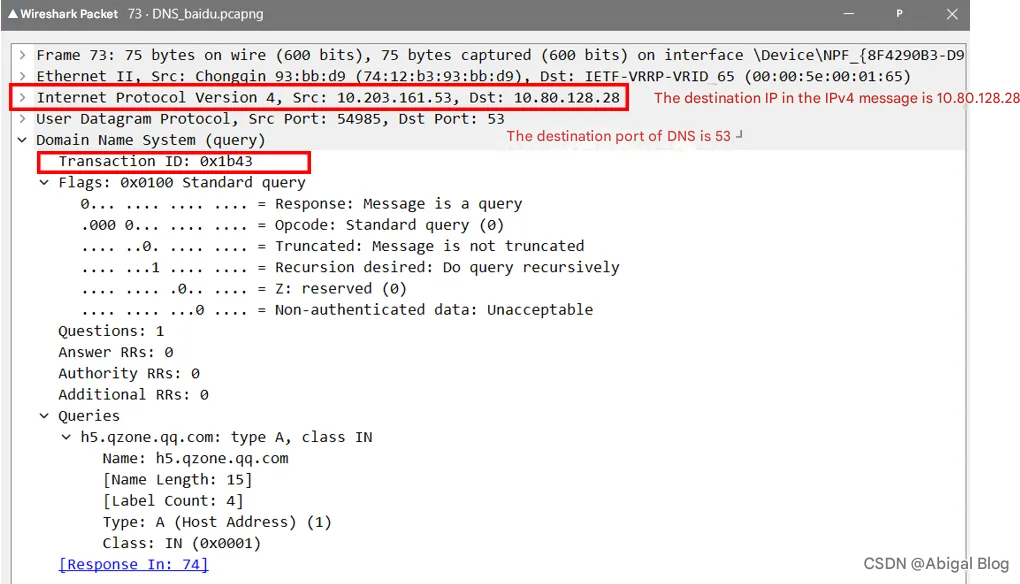
It can be found that DNS is an application layer protocol, the lower transport layer uses UDP, the lower network layer is the IP protocol, and then the Ethernet frame of the data link layer.
The first is the Transaction ID identification field, 2 bytes, used to identify which request message the DNS reply message is a response to: 0x1b43
The second is the Flags field , 2 bytes, the meaning of the bits are as follows:

QR : Query/Response, 1 for response, 0 for query: query in the example
Opcode : query or response type, 0 for standard, 1 for reverse, 2 for server status request
AA : Authorization answer, valid in the response message
TC : Truncation, 1 for more than 512 bytes and truncated, 0 for no truncation: truncated in the example
RD : Do you want a recursive answer
RA : 1 in the response message means a recursive response: not obtained in the example
zero : All 0 reserved field
rcode : Return code
Quetions (number of questions) , 2 bytes, usually 1
Answer RRs (number of resource records), Authority RRs (number of authorization resource records), Additional RRs (number of additional resource records) are usually 0
The Queries field is the body of the query or response, which is divided into Name Type Class
Name (query name): This is the parameter after ping, indefinite length ends with 0
Type (query type): 2 bytes, this is the host A record
Class (class): 2 bytes, IN means Internet data, usually 1
Analyze the response packet:
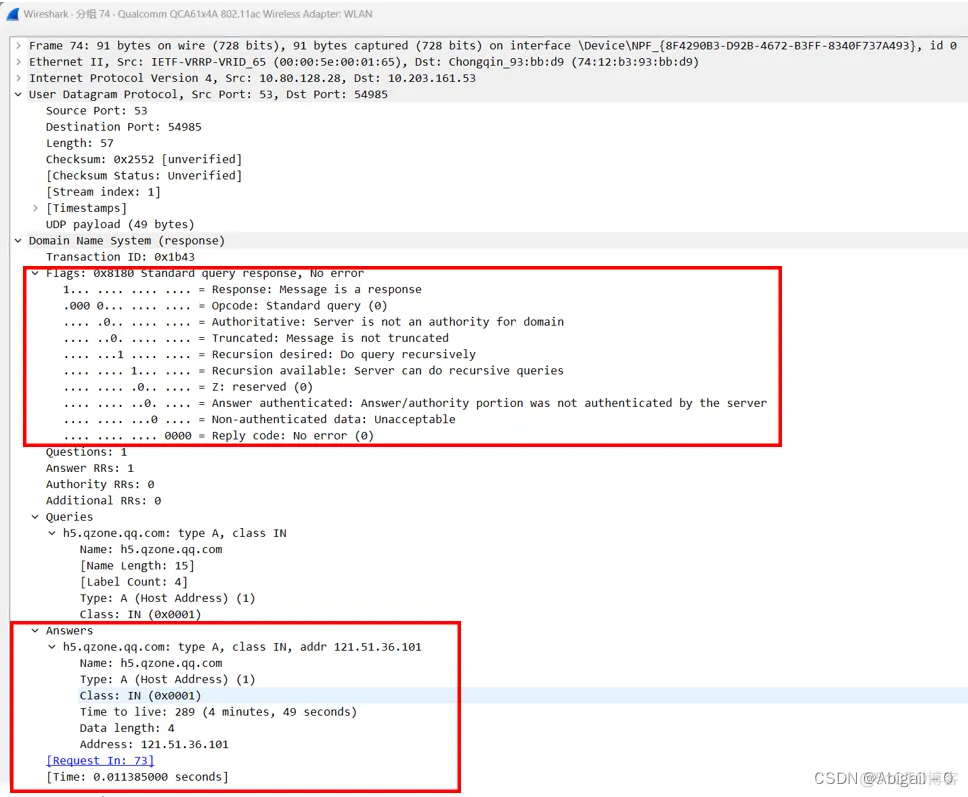
The response packet has an additional Answers field, and each bit of the Flags field is defined. If Answer RRs in Flags is 1, it means that there will be one parsing result in the corresponding Answers field.
The Answers field can be seen as a List, and each item in the collection is a resource record. In addition to the Name, Type, and Class mentioned above, there are also Time to Live, Data length, and Addr.
Time to Live (TTL): indicates the life cycle of the resource record, from the time the record is taken out to the time the record cache is erased, in seconds. A total of 289s.
Data length (resource data length): in bytes, the 4 here means that the length of the IP address is 4 bytes. That is, the length of the Addr field below.
Addr (resource data): The returned IP address is the result we want.
3. Test the tracert command and analyze its process.
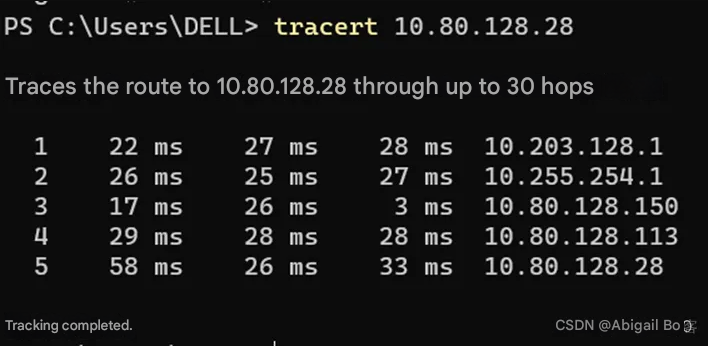
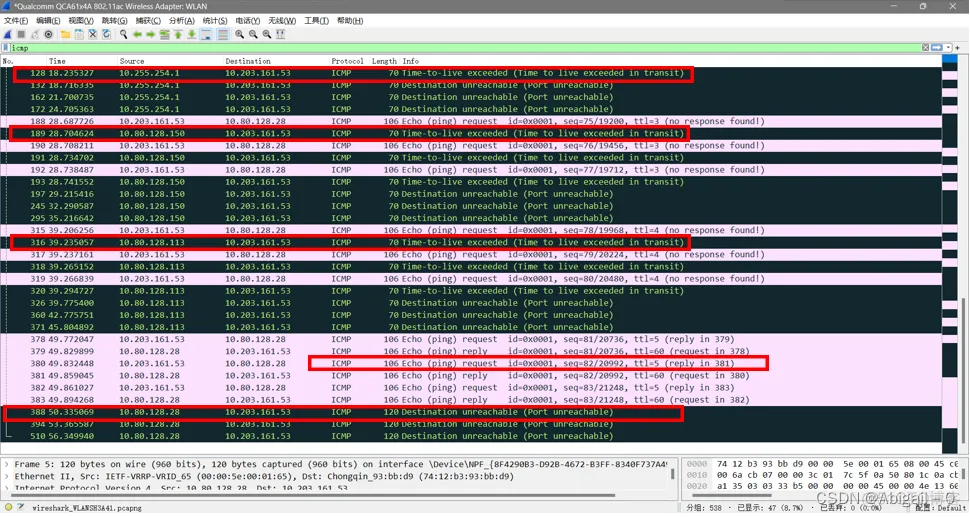

By observing the ICMP data packet, we can get:
Type: This field has 1 byte, indicating a specific type of ICMP message.
A host sends an ICMP message with a type field value of 8 to a node. If there is no abnormality on the way (if it is not discarded by the router, the target does not respond to ICMP or the transmission fails), the target returns an ICMP message with a type field value of 0, indicating that the host exists.
Code: This field has 1 byte and further subdivides the ICMP type. As shown in the figure above, the value of Type is 8 and the value of Code is 0, indicating an echo request.
Checksum: This field has 2 bytes and represents the checksum.
Identifier: This field has 2 bytes and is used to match the Request/Reply identifier.
Seq Num: This field has 2 bytes and is used to match the sequence number of the Request/Reply.
Data: data payload.
The pink data packets are sent by Tracert, and the black data packets are received by Tracert. When TTL=5, the source address receives the ICMP Echo Reply from the destination address, indicating that the source address has reached the destination address after 5 hops, which is consistent with the information displayed on the terminal .
4. Use nslookup to query domain name information and conduct a brief analysis.
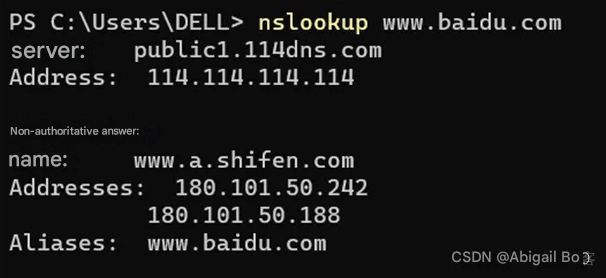

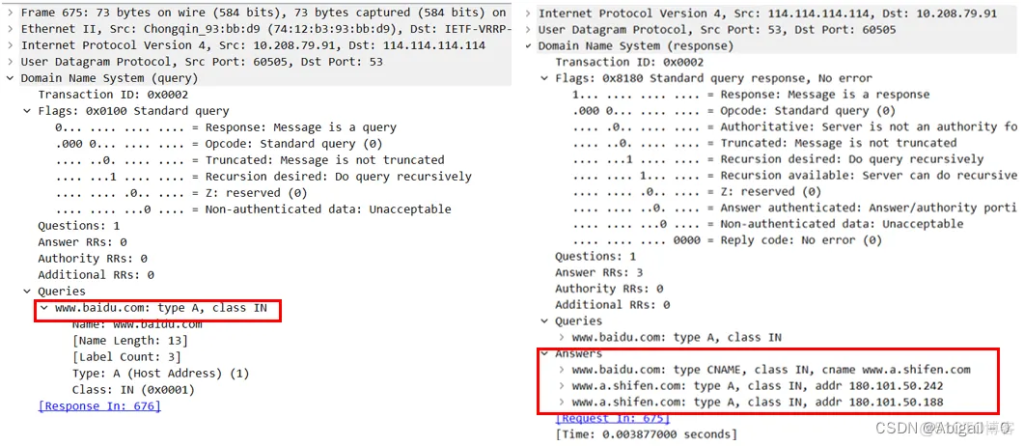
The message query name in the figure is: www.baidu.com, the query type is: A (IPv4 address), and the query class is: IN (Internet data).
3.2 Transport layer protocol analysis
3.2.1 TCP data flow tracking.
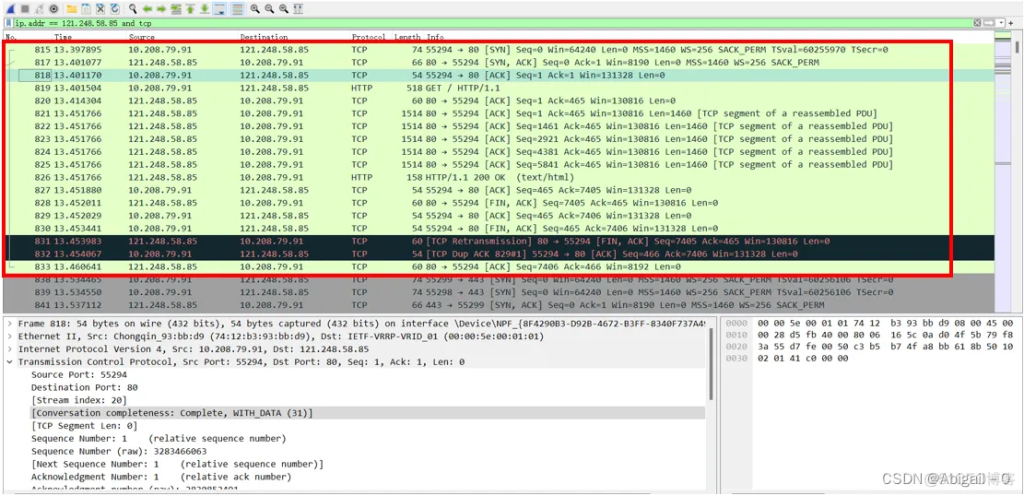
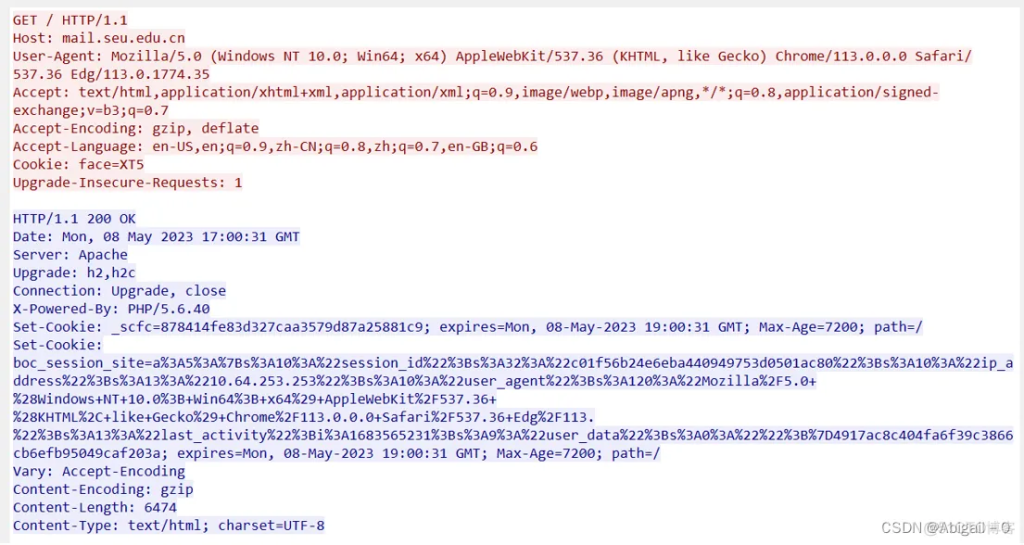
3.2.2 TCP connection establishment and termination timing diagram
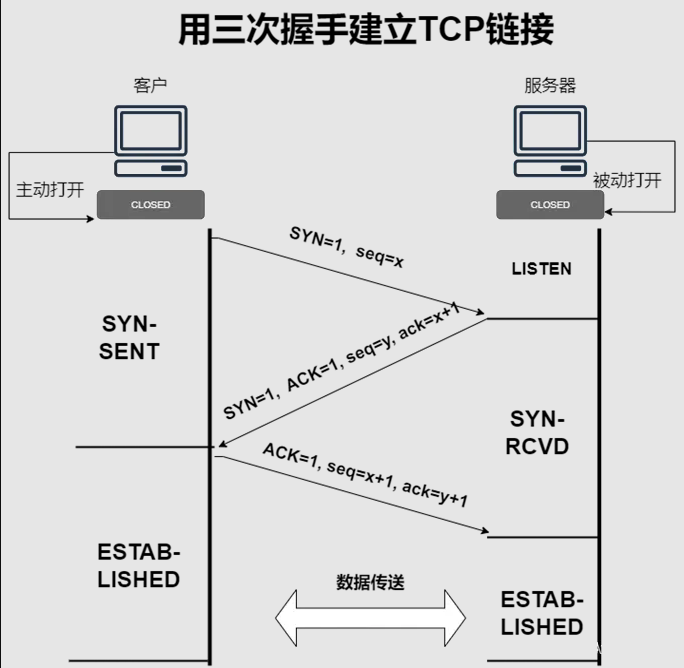
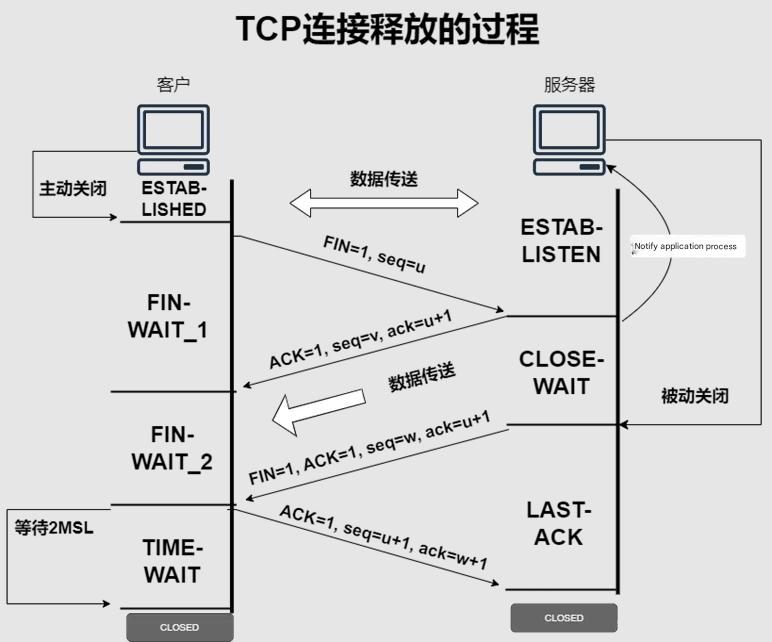
3.2.3 TCP message analysis.
The first message of the client’s connection request
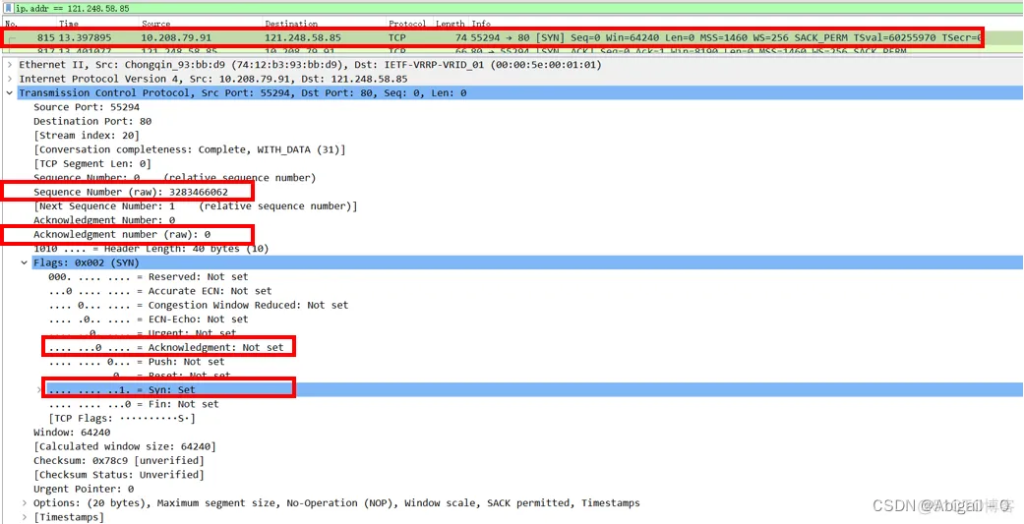
First, the client initiates a connection request to the server. Using the Wireshark packet capture tool, we can clearly parse all the field values in the TCP message header:
Source Port: source port, which is the port 55294 where the browser sends the connection request
Destination Port: 80, which is the default HTTP protocol response port 80
Sequence number: 0, this sequence number is the sequence number made by wireshark relative to the current TCP connection establishment, not the real sequence number
Sequence number (raw): 3283466062, this sequence number is the real sequence number of the TCP message header, that is, seq = 3283466062, the next request only looks at this change
Acknowledgment number: 0, confirmation number
Flags: that is, the control bit part, you can see that the flag bit at this time is SYN is 1; and the confirmation connection control bit ACK is 0
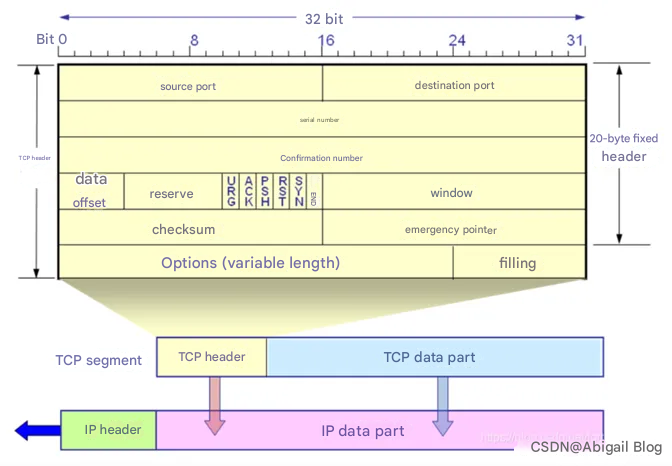
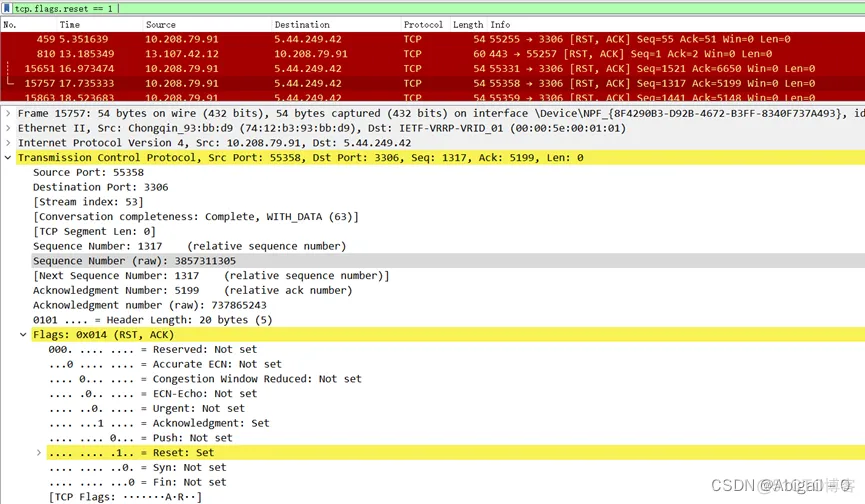
3.2.4 TCP connection reset.
4. Experimental Summary
After completing this experiment, I became more familiar with the use of Wireshark and mastered the use of packet capture, filters, etc. The transport layer and application layer protocols and messages were analyzed. The second experiment was the TCP three-way handshake and four-way handshake, which deepened my understanding of the TCP transmission process during the analysis of the message.


