Graphs are the bread and butter of analysis, and one of the best ways to get an overview of a data set. Unicorn includes a few different graphing features to assist in understanding capture data, the first of which is its flow graphing graphing capabilities.
TCP Flow Graphing
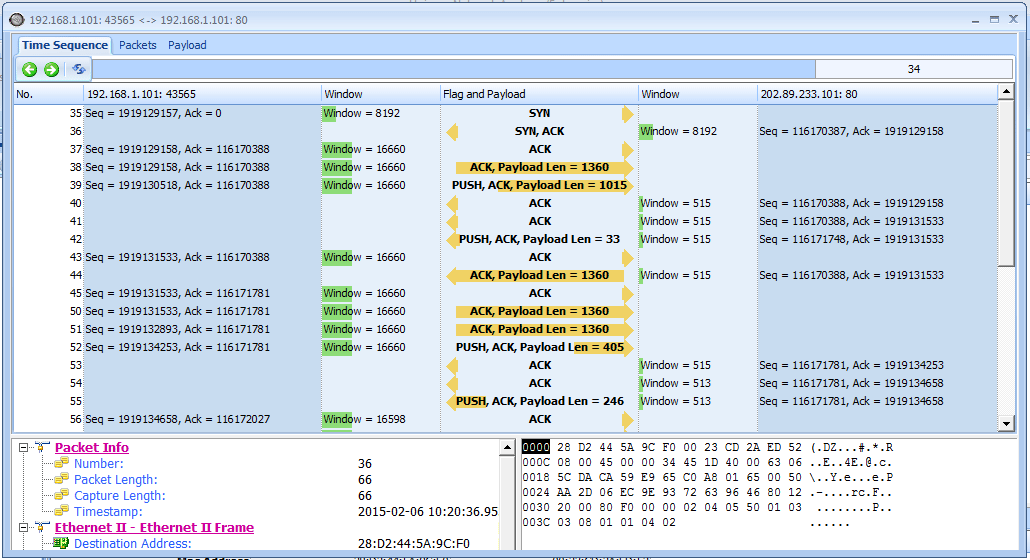
The TCP flow graphing feature is very useful for visualizing connections and showing the flow of data over time. Basically, a flow graph contains several columns based view of a connection between hosts and organizes the traffic so you can interpret it visually.
Lunch the Unicorn and start a new project, Accessing a web, e.g. www.ids-sax2.com, then switch to conversation tab, select a conversation and double-click the conversation selected to display the conversation detail window, see figure below:
Figure 5-11: The TCP flow graph allows us to visualize the connection much better.


