

Investigating a Production Issue in Ignite Caused by DNS Using Wireshark and Arthas
Background of the Issue
During a post-deployment check, maintenance personnel discovered an issue where client nodes could not connect to service nodes in the Apache Ignite cluster when executing data loading tasks via the client.
Production environment details: Divided into centers A and B Center A has 8 x86 architecture hosts as Ignite service nodes Center B has 8 Power architecture hosts as Ignite service nodes Ignite version is 1.10, JDK is 1.8
Issue feedback: When using an x86 client to connect to Power architecture service nodes, the client nodes could not connect. However, there were no issues when a Power client connected to Power service nodes, or when x86 or Power clients connected to x86 nodes.
Analysis of the Issue
Due to incorrect log4j2 logging configuration by developers, no error logs were visible in production.
Based on the information from maintenance personnel, there are two suspected causes of the issue: 1. Cross-architecture causing the issue, as the client is x86 architecture and the service node is Power architecture. 2. Network issues causing the problem, suspected to be due to cross-center and cross-network segment issues.
First Attempt to Identify the Issue
Cross-Architecture Hypothesis
To test the first hypothesis, a parallel environment simulation was conducted, but the issue could not be reproduced. Therefore, the issue had to be reproduced in the production environment for further investigation.
Reproducing the Issue in Production
After modifying the log4j2 logs, error information was obtained (the following is from a subsequent local environment simulation, with error content consistent with production): Server node error:
Client error log:
Wireshark Packet Capture Analysis
Using tcpdump, packet captures were performed on both the client and server to analyze the network situation. Command used: tcpdump -i ens192 host 10.1.12.XXX and port 47500 -w server.pcap
Port 47500 is the port number for establishing a connection between the Ignite client and server. ens192 specifies the network card.
Server packet capture is as follows:
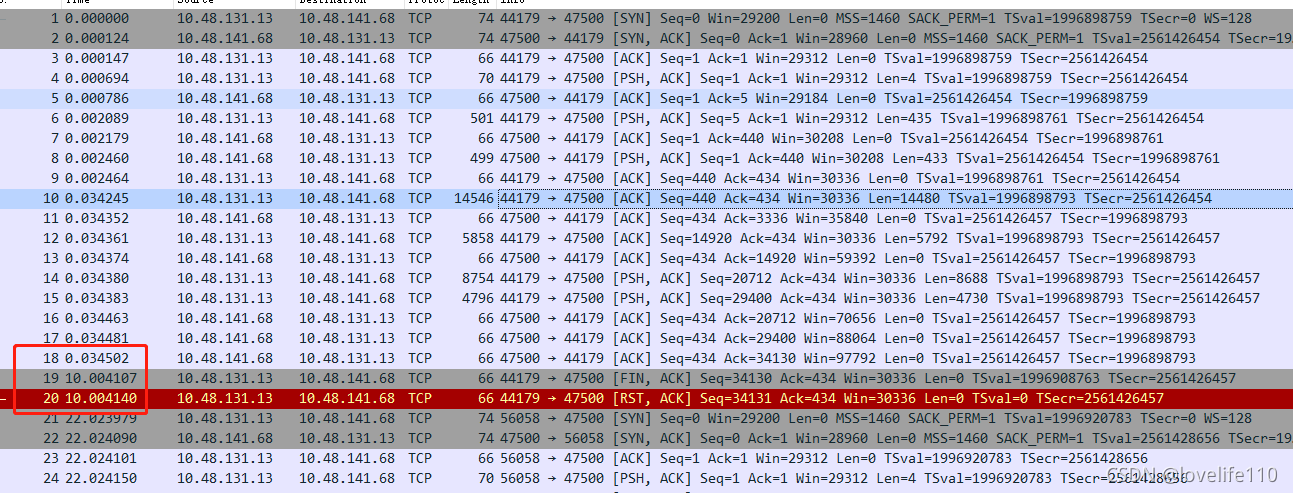
In the TCP layer, there is a FLAGS field with the following indicators: SYN, FIN, ACK, PSH, RST, URG. SYN indicates establishing a connection FIN indicates closing a connection ACK indicates acknowledgment PSH indicates data transfer RST indicates connection reset
Key analysis points: Line 10, combined with source code analysis, shows the client sending a TcpDiscoveryJoinRequestMessage packet to the server, seq=440, ack=434, Len=14480
The server successfully receives it, as shown in line 13, seq=434, ack=14920, Len=0
Note: In an already established TCP connection (considering only data packets and ack packets), the calculation rules for seq and ack are: The seq of the packet to be sent = the seq of the last sent packet + the length of the last sent packet (excluding the header) The ack of the packet to be sent = the seq of the last received packet + the length of the last received packet (excluding the header)
In the circled part of the above figure, it is observed that there is a 10-second gap between line 19 and line 20, and the client (10.48.131.13) initiates a [RST, ACK] reconnection.
Continuing to retry, observe the following:
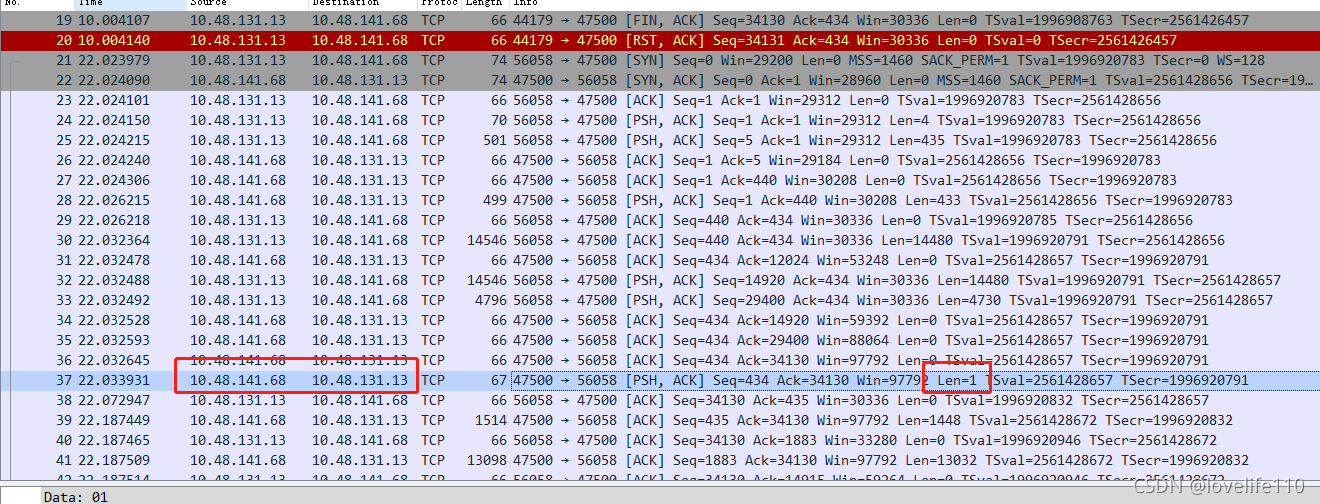
In the client’s retry TCP packet, line 37 shows a response packet (RES_OK) with len=1 being sent, but before the retry, the server did not send this response packet. Combined with the TcpDiscoveryJoinRequest source code, the conclusion is:
The server took a long time to process the TcpDiscoveryJoinRequest packet for the first time, and the client socket timed out after 10 seconds, leading to a reconnection. After the reconnection, everything was normal.
Client 10-Second Timeout Source Code Tracking
ClientImpl line 805:
timeoutHelper.nextTimeoutChunk continues to follow IgniteSpiOperationTimeoutHelper:
The value of timeoutThreshold originates from ClientImpl line 722:
Then follow to IgniteSpiOperationTimeoutHelper line 58
srvOp is true, i.e., System.nanoTime() + failureDetectionTimeout, with failureDetectionTimeout defaulting to 10 seconds
After finding the source code, the client modifies the timeout setting as follows:
Checking Server Logs for Bottlenecks
According to the logs, at 11:05:50,288, the server received “Initialized connection with remote client node,” and at 11:06:05,325, the server logged “Message has been received.” The conclusion is that the server was stuck for 15 seconds.
Second Attempt to Identify the Issue
After discovering the server’s 15-second timeout issue, it was decided to use Arthas to continue tracking which method in production caused such a long delay.
Arthas Identification
Using Trace to Identify Time-Consuming Methods
Based on the server error information, it was found that the method org.apache.ignite.spi.discovery.tcp.ServerImpl$SocketReader.body had issues.
Execute the trace command to track: trace org.apache.ignite.spi.discovery.tcp.ServerImpl$SocketReader body ‘#cost>10000’
It was found that the unmarshal() method was the most time-consuming, so continue tracing: trace –skipJDKMethod false org.apache.ignite.marshaller.jdk.JdkMarshaller unmarshal0 ‘#cost>10000’ Note: –skipJDKMethod false enables tracking of JDK methods, and enabling options unsafe true (system-level classes, i.e., java.*, cannot be enhanced by default; refer to the unsafe switch for enhancement of system classes, and proceed with caution)
Through trace and source code review, it was generally understood that the service node was stuck in deserialization code.
Using Thread to Check Threads
It is also possible to determine the error thread through the log “ERROR tcp-disco-sock-reader-” and use Arthas’s thread to check where the tcp-disco-sock-reader thread is stuck: Execute command: thread -all | grep tcp-disco-sock-reader- Result obtained:
Based on the thread ID, continue to check where this thread is stuck: Execute command: thread 2362 Result obtained:
At this point, it has been confirmed that the hostname caused this issue.
jstack
jstack can also export the stack information of stuck threads, using the following command: jstack -l PID >> output.log, where PID can be obtained through JPS
After obtaining the result, filter out the tcp-disco-sock-reader thread information
kill -3 pid
Since Arthas or jstack cannot be used under the Power architecture, it is also possible to export the stack of stuck threads using kill -3 with the pid Command as follows: kill -3 pid, where pid can be found through jps The result will be output to the console, filter out the tcp-disco-sock-reader thread information
Final Issue Identification
From the above analysis, it has been determined that the local issue was caused by the hostname. Comparing the production configuration revealed: The Power service node configured the hostname of the Power client in /etc/hosts, but did not configure the hostname of the x86 client node, While the x86 service node configured the hostnames of both x86 and Power clients, leading to the issue where the x86 client could not connect to Power architecture service nodes. However, there were no issues when x86 or Power clients connected to x86 nodes.
For this issue, there is a prerequisite: the client node must have its hostname configured in /etc/hosts on its own machine. If not configured, the issue will not occur.
As for the relationship with DNS, the reason is as follows: The code causing the issue is InetSocketAddress(String hostname, int port), which automatically resolves the hostname, i.e., DNS resolution, to obtain the IP and then connect;
The issue was not discovered in the previous production environment because DNS was not enabled. This time, due to other business going online, DNS was enabled.
Related configuration is as follows: Previously, DNS was not enabled: cat /etc/nsswitch.conf hosts: files This time, maintenance added dns after files to enable DNS, causing the issue hosts: files dns
15-second configuration is as follows: Located in /etc/resolv.conf options timeout:5 attempts:3 rotate Timeout is 5 seconds, retry count is 3
Summary: The bug was caused by two reasons: first, the Power service node missed configuring the hostname of the x86 client, and second, enabling DNS during maintenance, causing DNS to fail to resolve the hostname, resulting in a 15-second delay.
Reviewing Ignite Source Code
Client Collecting Local Information
First, before the client starts joining nodes, it collects local information, which includes the hostname. Source code tracking is as follows:
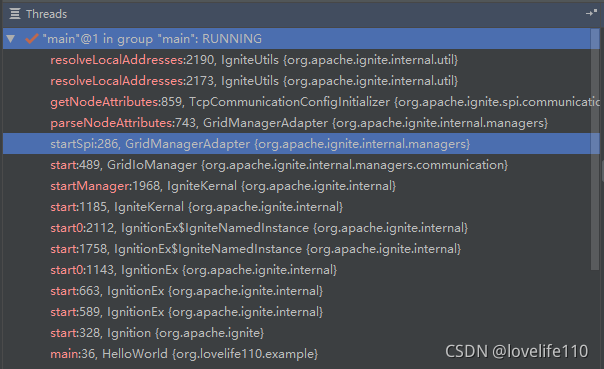
In the IgniteUtils class,
In the addresses(addr, addrs, hostNames, allHostNames) method, the hostname is obtained That is, the InetAddress getHostName method
If the client node has its hostname configured in /etc/hosts on its own machine, the code will store the hostname in the joining node (locNode).
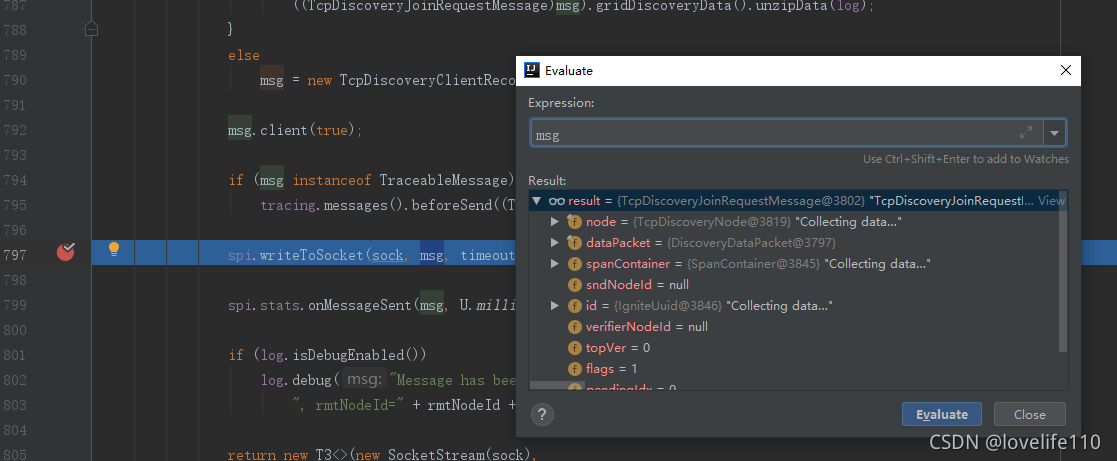
Finally, ClientImpl packages the client node to be joined (including the above hostname) as a TcpDiscoveryJoinRequestMessage and sends it to the server.
Server Deserializing and Parsing Hostname
The client sends the TcpDiscoveryJoinRequestMessage to the server, which deserializes it. The code is in ServerImpl line 7066,
U.unmarshal calls the ObjectInputStream’s readObject method at the bottom, and ObjectInputStream calls the readExternal interface. In Ignite, TcpDiscoveryJoinRequestMessage overrides readExternal, and in the overridden readExternal, InetSocketAddress is initialized.
TcpDiscoveryJoinRequestMessage mainly includes TcpDiscoveryNode and DiscoveryDataPacket
TcpDiscoveryNode includes writeExternal and readExternal
Reviewing the readExternal source code, it includes initializing InetSocketAddress:
Continue to follow the U.toSocketAddresses source code to find InetSocketAddress: